AI Breakout Detection Crypto: How It Works
AI Breakout Detection Crypto: How It Works
Understanding Breakouts
In the world of trading, a breakout occurs when the price of an asset moves beyond a defined resistance level or below a support level. This movement often indicates a strong shift in market sentiment and can lead to significant price movements. For crypto traders, identifying these breakouts quickly is crucial to capitalizing on potential price surges or declines.
Breakout detection is essential for successful trading. It allows traders to enter positions early and maximize profits before the market settles into its new trend. An effective crypto breakout scanner can help automate this process, leveraging sophisticated algorithms to analyze price action and detect breakouts in real-time.
Real Trading Example: BTC
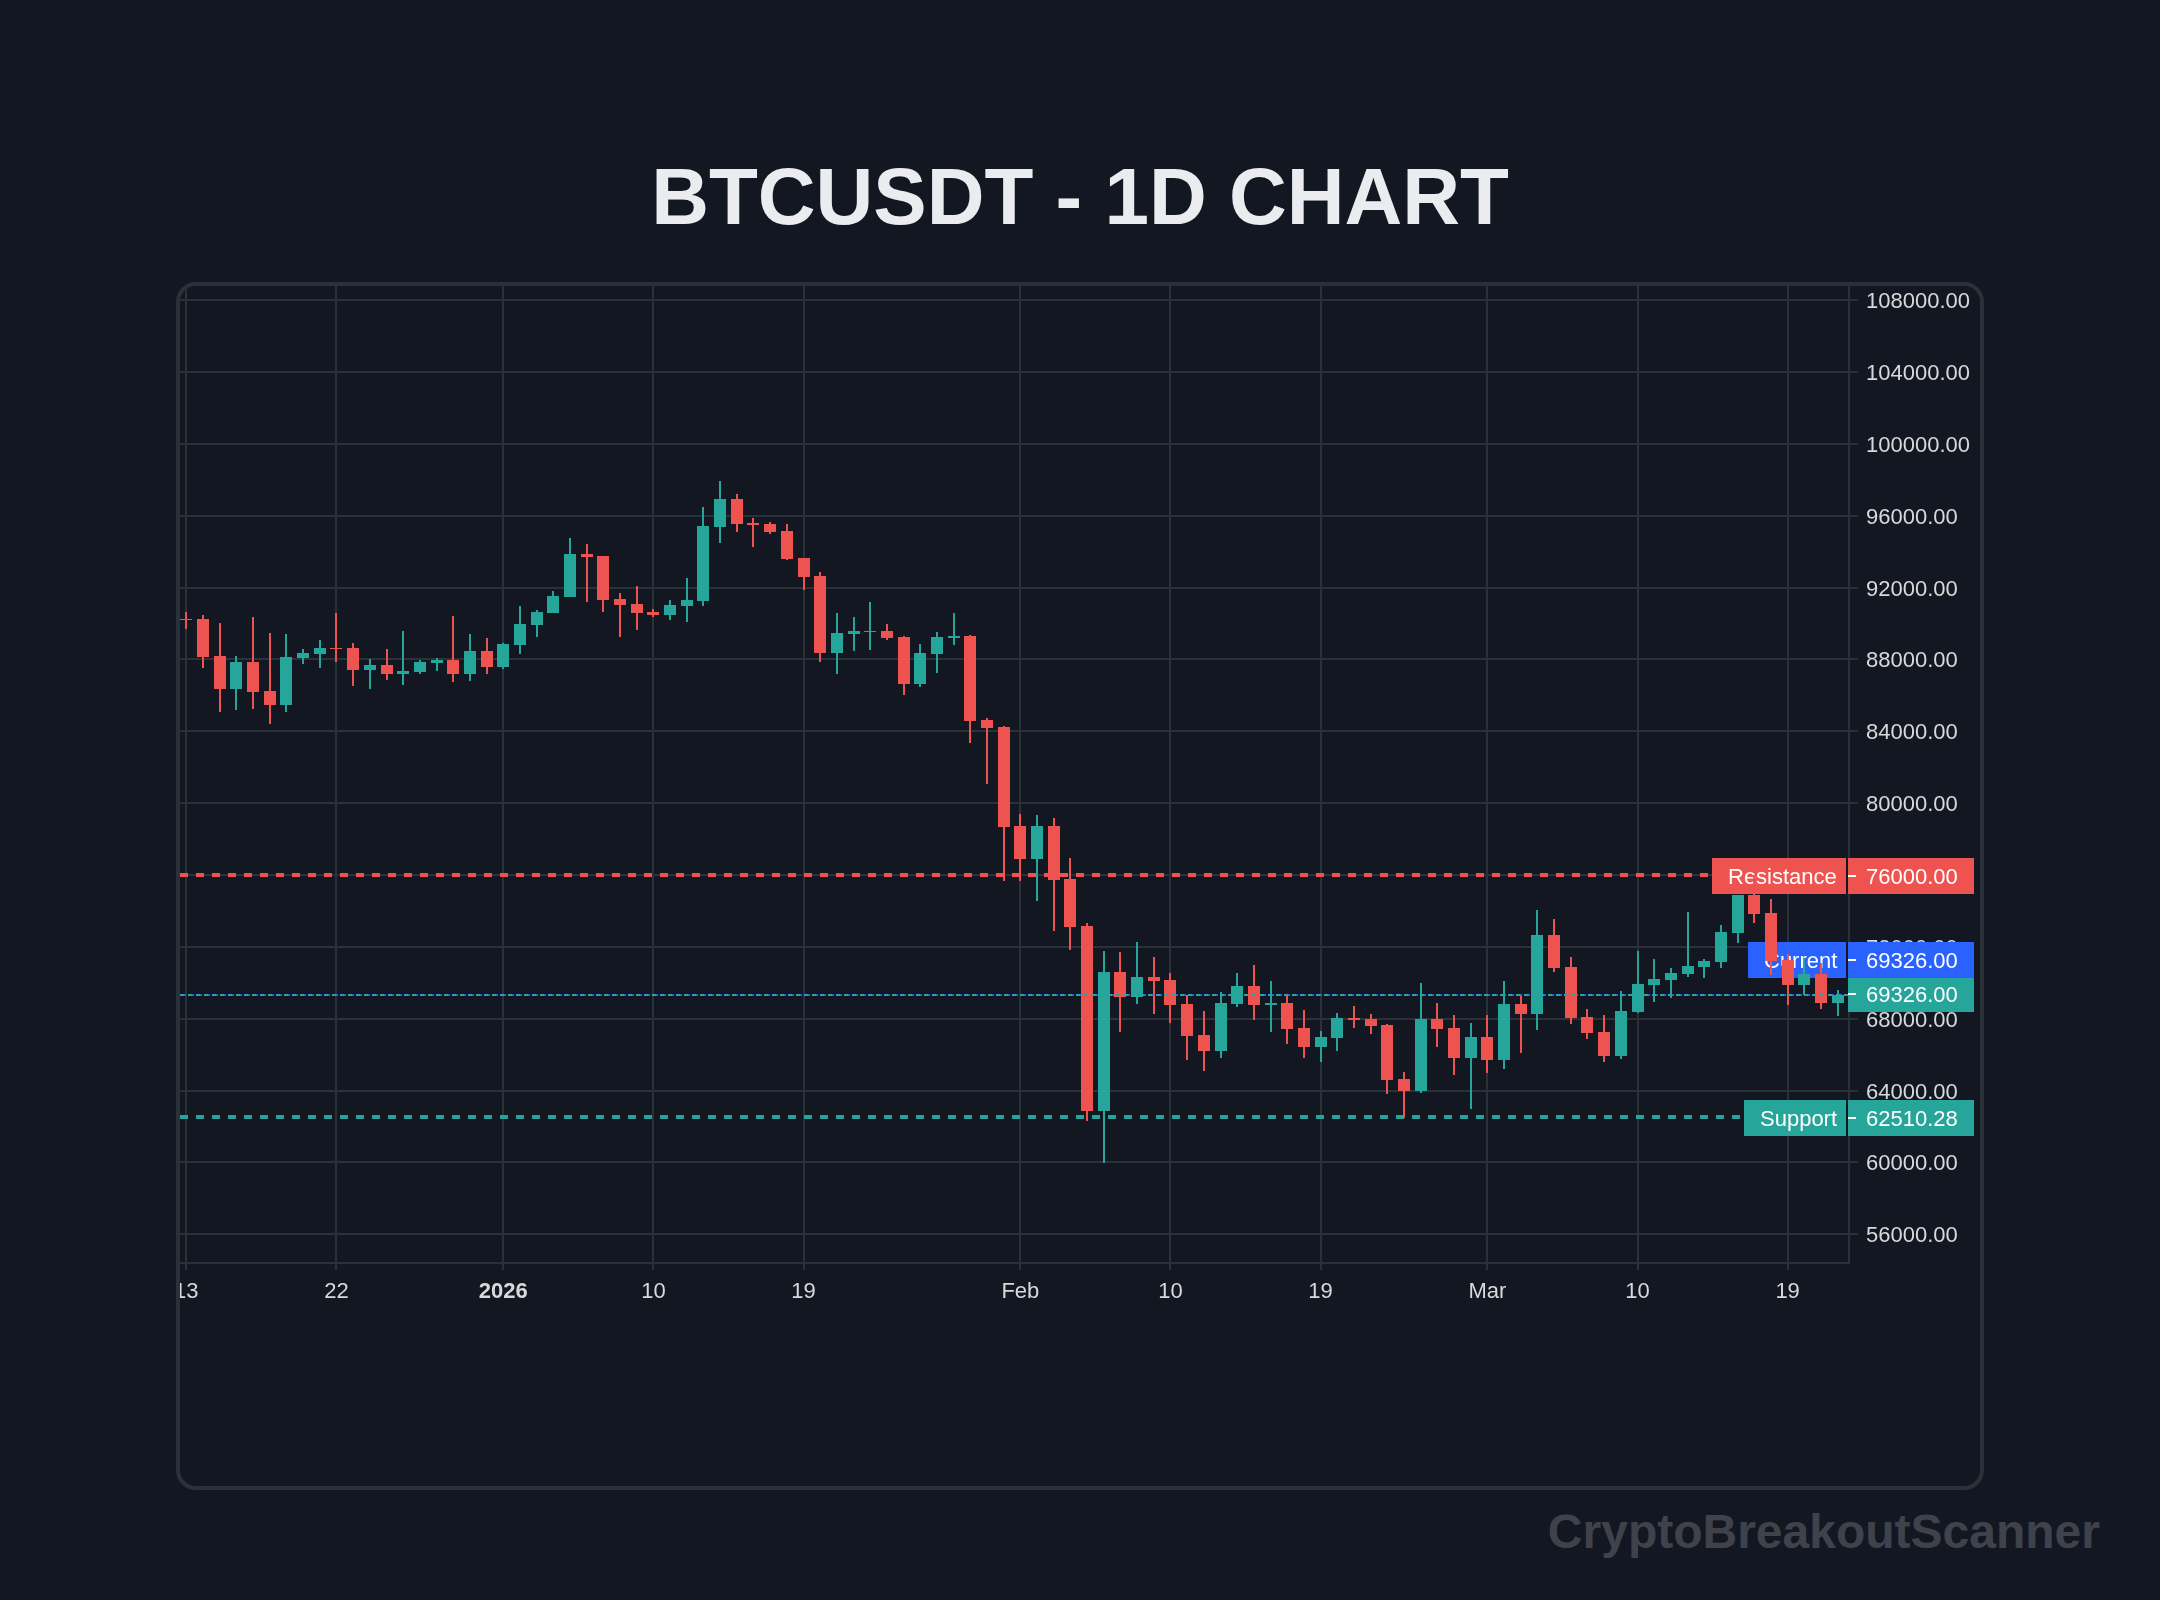
Let’s dive into a practical example with Bitcoin (BTC). On March 15, 2026, BTC traded at $70,000, facing strong resistance at this level. Traders were watching closely as the price approached this mark. The crypto breakout alerts began to ring as BTC broke through this resistance at $70,200 with notable volume.
Within hours, BTC surged to $75,000, providing a substantial profit opportunity for those who recognized the breakout signal. This real-time alert showcases the power of having an efficient crypto breakout screener that monitors price movements and notifies traders instantly.
Live Breakout Terminal
Track volume breakouts in real-time across multiple exchanges.
Confirmation Indicators
When trading breakouts, relying solely on price action can be risky. Confirming a breakout with indicators ensures that the move is legitimate. Here are some key indicators to consider:
- RSI (Relative Strength Index): Look for RSI values above 50 to confirm bullish momentum during a breakout.
- Volume: A breakout accompanied by volume at least 1.5 times the average signals stronger conviction in the price movement.
- Price Structure: Watch for higher highs and higher lows in a bullish breakout. In a bearish scenario, the opposite applies.
Utilizing these indicators in conjunction with a breakout confirmation strategy can significantly increase your trading success rate.
Fake Breakout Detection
Not all breakouts are genuine. Fakeouts can lead to significant losses. Here’s how to spot them:
- Wicks: Large wicks on candlesticks can indicate a rejection of higher prices. If the price quickly returns below resistance or above support, it may be a fakeout.
- Volume Divergence: If the breakout occurs with lower volume than expected, it may signal a lack of interest from traders, suggesting a potential fakeout.
- Key Tests: If the price attempts to break out multiple times without success, it could indicate a weak breakout.
A solid fake breakout detection guide is invaluable in navigating these false signals.
Risk Management Formula
Risk management is critical in breakout trading. One simple yet effective formula is:
- Risk = Account Size × 1%. This means you should only risk 1% of your total trading account on any single trade.
- Stop Loss (SL) Placement: Set your stop loss just below the breakout point for a buy trade or above for a sell trade. This protects you if the breakout fails and prices reverse.
Implementing a robust risk management strategy can help you stay in the game longer and maximize returns.
Step-by-Step Trading Approach
When you receive a breakout signal, follow these steps:
- Confirm the Breakout: Use RSI, volume, and price structure indicators to validate the breakout.
- Set Entry Point: Enter the trade just above the breakout level.
- Place Stop Loss: Set your stop loss appropriately to manage risk.
- Monitor Volume: Ensure that volume supports the breakout.
- Take Profit Levels: Identify profit targets based on historical resistance levels or using a risk-reward ratio.
- Adjust as Needed: Be prepared to adjust your stop loss to lock in profits as the price moves favorably.
Following this structured approach increases your chances of successful trades and maximizes potential profits.
FAQ Section
What is a breakout in crypto trading?
A breakout in crypto trading occurs when the price moves beyond a defined support or resistance level, signaling potential price momentum.
How does an AI breakout scanner work?
An AI breakout scanner analyzes market data, identifying patterns and price movements to detect potential breakouts and send alerts.
What indicators confirm a breakout?
Key indicators include RSI values over 50, volume exceeding average levels, and price structure showing higher highs.
How can I avoid fake breakouts?
Watch for large wicks, low volume during breakouts, and repeated failures to break through resistance or support levels.
What is the best risk management strategy for breakouts?
Risk only 1% of your account per trade and place stop losses just below breakout levels to protect against losses.
Why is volume important in breakout trading?
Volume confirms the strength of a breakout. Higher volume indicates strong interest and conviction in the price move.
How do I set profit targets in breakout trading?
Profit targets can be set at historical resistance levels or by using a risk-reward ratio to guide exit points.
Can automated alerts improve my trading results?
Yes, automated breakout alerts help you act quickly on breakout opportunities, ensuring you don’t miss profitable trades.
Crypto Breakout Scanner delivers real-time breakout alerts on Telegram the moment a coin breaks out — on 3m, 5m, and 15m timeframes. Join free and start catching breakouts instantly.
Keywords: Breakout Strategy, Trading Strategy, Technical Analysis, Risk Management
September 2026 Update: What's Changed
I've been watching the crypto market like a hawk, and honestly, things are heating up. Bitcoin's sitting at $81,293, up nearly 4% in the last 24 hours. That’s not just noise; it shows there's momentum behind this move. Look — we hit a high of $81,741 and a low of $77,972 just in a day. These swings are what traders live for.
So, what's the deal? Breakouts are happening, and you need to be ready for them. Real talk: if you’re not using a crypto breakout scanner right now, you’re missing out. The key is catching these moves early. Remember the last big breakout we saw? Those who jumped in when Bitcoin crossed $60k reaped serious rewards.
And by the way, if you’re using breakout alerts, you’ve got a solid advantage. This isn’t just about luck; it’s about strategy. You need to identify when Bitcoin, or any crypto, is about to make that leap. Trust me, patience pays off big time when you’re watching those charts.
Here’s the thing — the market’s unpredictable. One minute, I’m feeling on top of the world, and the next, I’m holding my breath. Just last week, I saw some wild movements that had me second-guessing. Truth is, the market can flip in a heartbeat. Are you ready for it?
As we move forward, I expect more volatility. When resistance levels break, the gains can be huge. But beware; it can swing down just as fast. Keep your eyes peeled and be ready to act. This is where the exciting profits lie.
Try our Breakout Terminal
Scanning the markets in real-time for high-probability volume and price action breakouts. Access the scanner for free.
David Park
David Park is a crypto analyst and trader specializing in breakout strategies and real-time market signals. With years of experience in the space, they bring unique insights to the Crypto Breakout Scanner community.