Best Breakout Indicator Combination Crypto for 2024
Best Breakout Indicator Combination Crypto for 2024
Trading breakouts is a powerful strategy. It’s about identifying opportunities when prices break through established levels. Knowing which indicators to use can tip the balance in your favor. In this article, we’ll explore the best breakout indicator combination that can enhance your trading results in 2024. Let’s dive in.
What is a Breakout?
A breakout occurs when the price of a cryptocurrency moves above a defined resistance level or below a support level with increased volume. This shift often indicates a new trend is beginning. Traders look for breakouts to enter positions that can lead to significant price movements.
For example, if Bitcoin (BTC) is trading at $70,000 and suddenly breaks above $70,500 with heavy buying pressure, that breakout may signal the start of an upward trend.
Real Trading Example
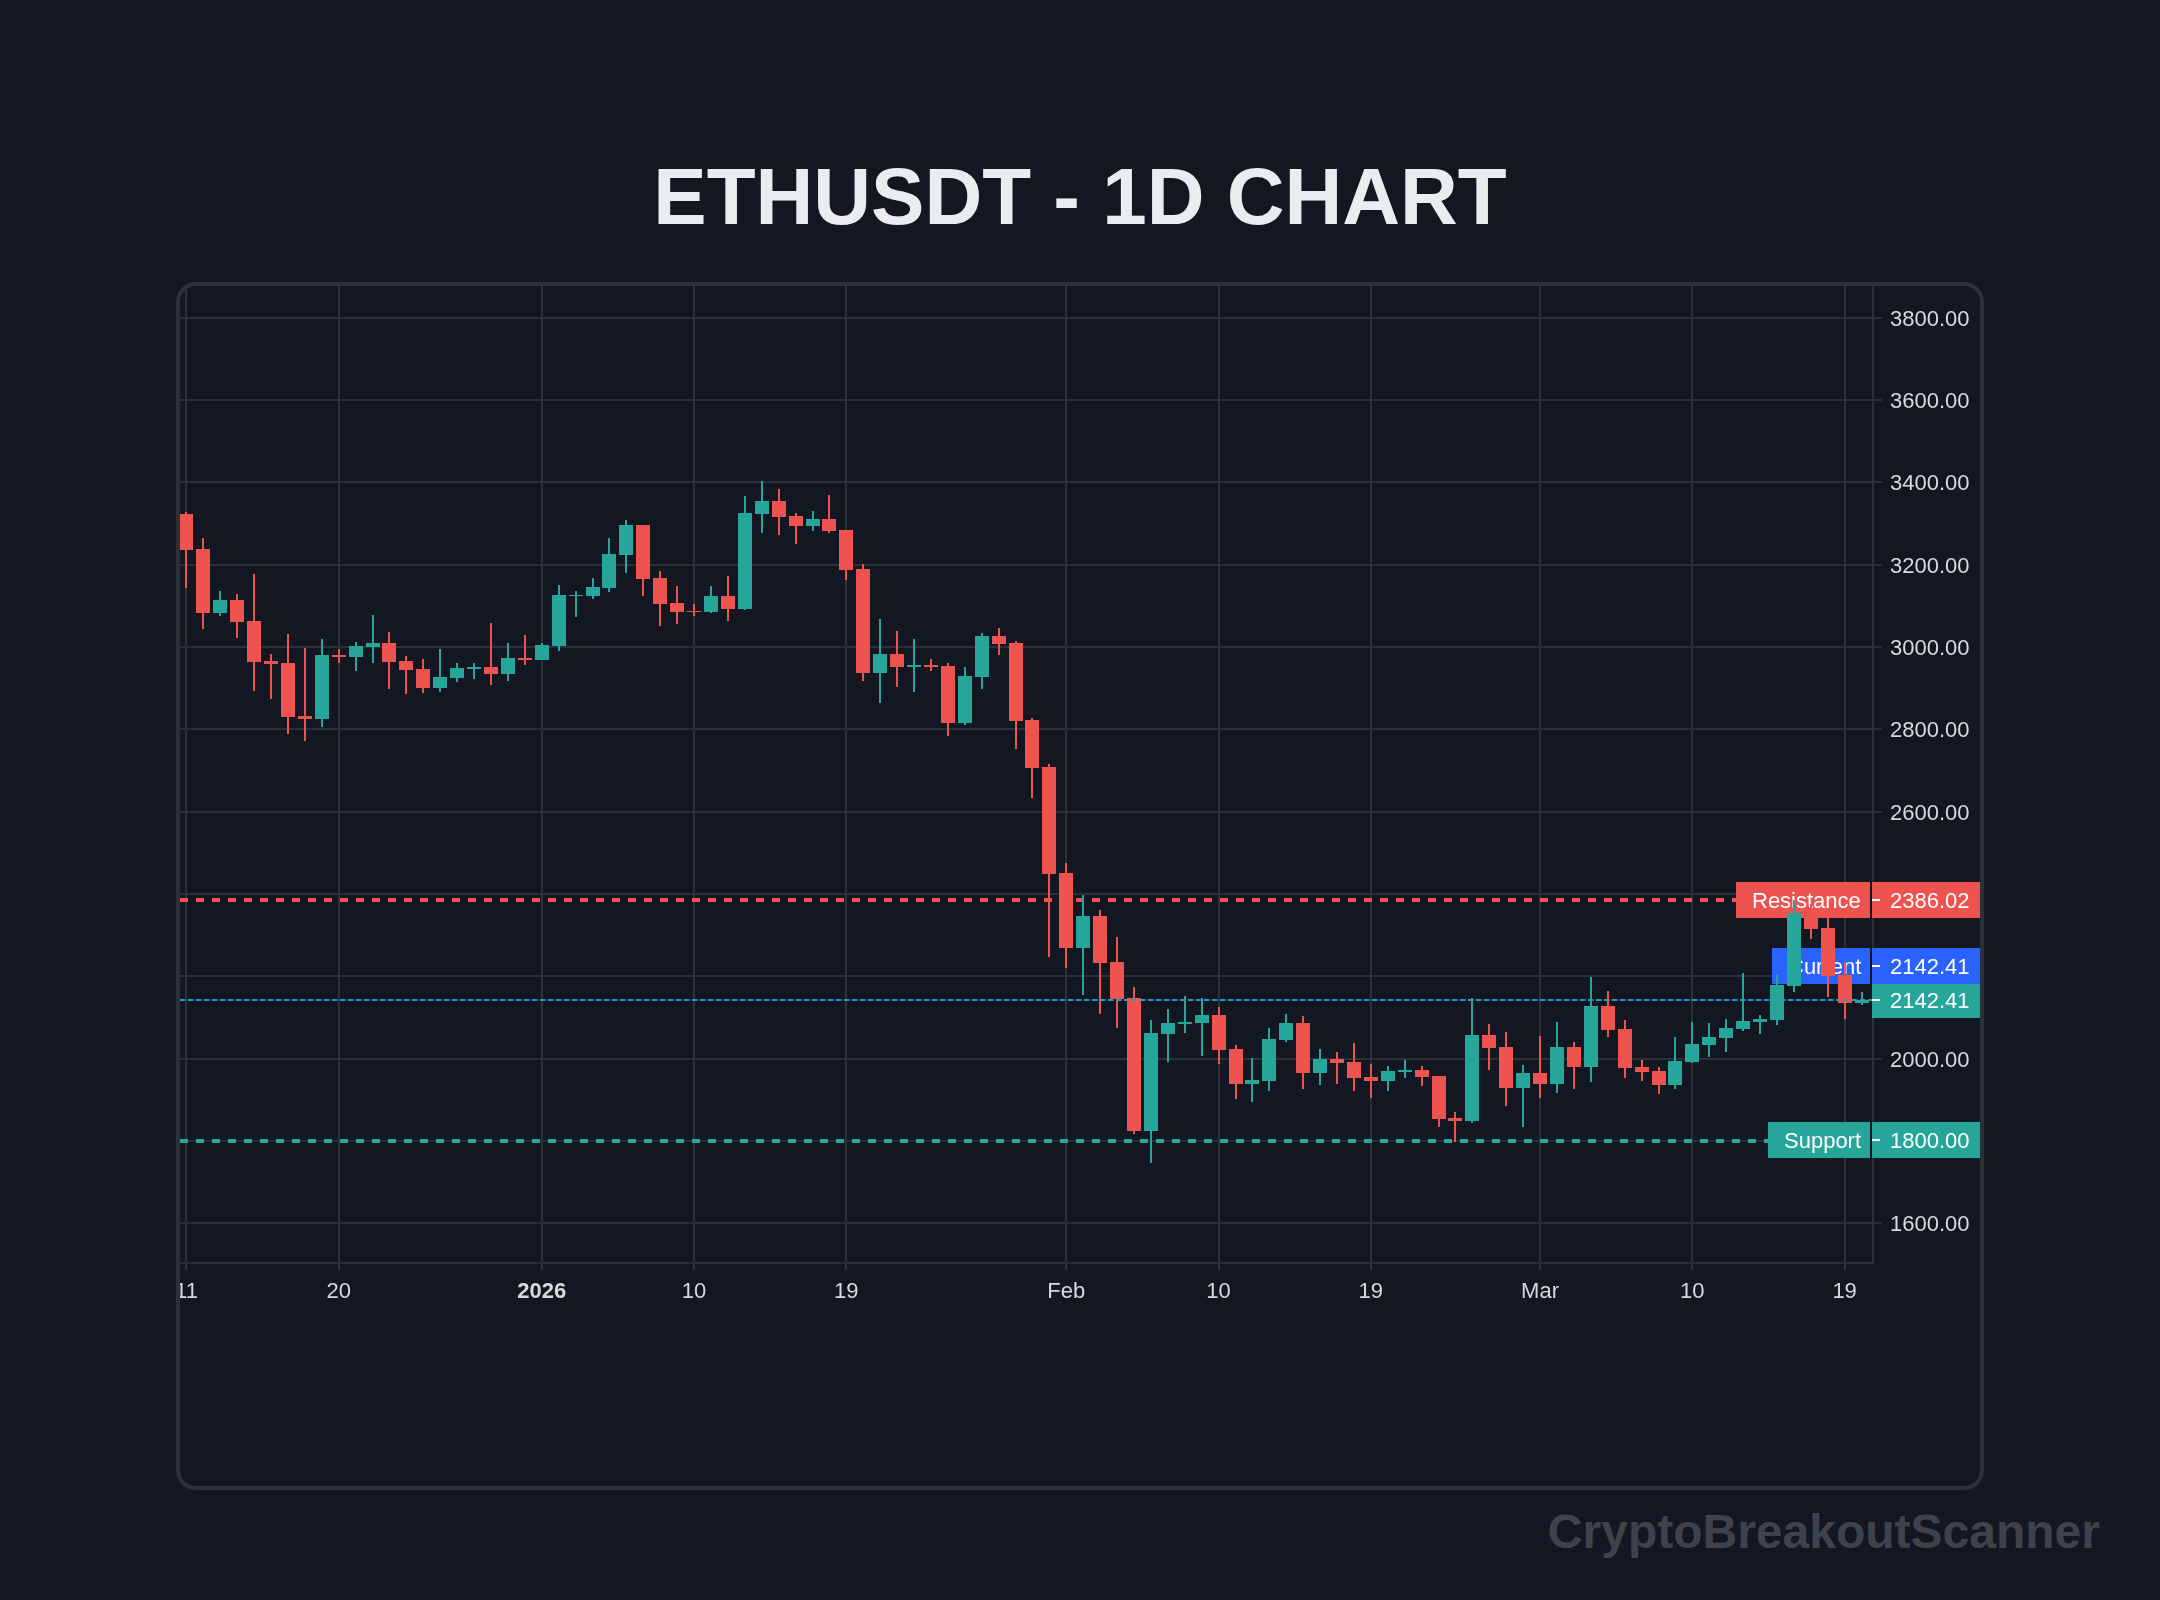
Let’s consider a recent breakout in Ethereum (ETH). On February 15, 2026, ETH was trading at $2,650. It had been consolidating around this level for several days. Suddenly, it broke above $2,700 with a surge in volume.
- Price Level: $2,700
- Timeframe: 15-minute chart
- Action: The breakout confirmed with a closing candle above $2,700 and RSI climbed above 60. Within hours, ETH shot up to $2,900, providing a solid trading opportunity for those who acted quickly.
Notably, using a crypto breakout scanner can help you catch these moves in real time, maximizing your chances of success.
Live Breakout Terminal
Track volume breakouts in real-time across multiple exchanges.
Confirmation Indicators
When trading breakouts, confirmation is key. Here are three critical indicators to consider:
1. RSI (Relative Strength Index)
- What to Look For: An RSI above 50 usually indicates bullish momentum. If the RSI climbs above 70, the asset may be overbought.
- Usage: When a breakout occurs and RSI is above 50, it confirms strength.
2. Volume
- What to Look For: A significant volume increase, ideally 1.5x the average volume, suggests strong buying or selling interest.
- Usage: If the breakout happens with high volume, it validates the move.
3. Price Structure
- What to Look For: Observing previous highs and lows can provide context. A breakout above recent highs is more reliable.
- Usage: If ETH broke the $2,700 resistance, it should ideally close above that level to confirm the breakout.
Combining these indicators enhances your breakout confirmation strategy and helps mitigate risks.
Fake Breakout Detection
Not every breakout leads to a sustained move. Here’s how to spot potential fakeouts:
- Wicks: A long wick on the breakout candle can indicate rejection. If the price quickly returns below the breakout level, it’s a warning sign.
- Volume Divergence: If volume is low during a breakout, it raises red flags. Look for high volume on the breakout, not just on the preceding consolidation.
- Key Tests: After a breakout, watch how the price behaves at previous resistance. If it fails to hold above the breakout level, consider it a potential fakeout.
Utilizing a fake breakout detection guide can help you refine your strategy and avoid costly mistakes.
Risk Management Formula
Risk management is crucial in breakout trading. Here’s a simple formula:
- Risk = Account Size × 1%
For instance, if your account size is $10,000, your maximum risk per trade should be $100. This keeps your losses manageable.
Stop Loss Placement Rules
- Place your stop loss just below the breakout level for long positions.
- For example, if you entered ETH at $2,700, consider placing your stop loss at $2,680 to allow for minor fluctuations.
This approach manages risk while allowing for potential upside.
Step-by-Step Trading Approach
When you receive a breakout signal, follow these steps:
- Verify the Breakout: Check if the price closes above resistance with confirming indicators (RSI, volume).
- Set Your Entry: Enter the trade as soon as the breakout is confirmed.
- Determine Stop Loss: Place the stop loss below the breakout level.
- Manage Position Size: Use your risk management formula to determine how much to invest.
- Monitor Indicators: Keep an eye on RSI and volume to gauge momentum.
- Take Profit Levels: Set clear profit targets based on previous resistance levels.
- Adjust Stop Loss: As the price moves in your favor, consider trailing your stop loss to lock in profits.
By following these steps, you can implement a disciplined approach to trading breakouts effectively.
FAQ
What is the best combination of indicators for breakout trading?
The best combination often includes RSI, MACD, and volume. These indicators together provide a comprehensive view of market momentum.
How do I set up a crypto breakout scanner?
A crypto breakout scanner can be set up using various trading platforms. Look for features that allow you to set alerts based on specific price movement and volume criteria.
What is a fake breakout?
A fake breakout occurs when the price appears to break through a significant level but quickly returns to its previous range, leading to losses for traders who entered positions based on the false signal.
How can I improve my breakout trading strategy?
Improving your strategy involves backtesting different indicator combinations, practicing risk management, and learning to identify market conditions that favor breakouts.
When should I exit a breakout trade?
Exiting should be based on your profit targets or if the price fails to maintain momentum, such as a close below the breakout level.
How do I identify strong support and resistance levels?
Strong support and resistance levels can be identified through historical price action, trendlines, and using tools like Fibonacci retracement levels.
What resources are available for automated breakout alerts?
Many trading platforms offer automated breakout alerts. Look for those that can integrate with your trading strategies and provide real-time notifications.
How can I use the RSI volume breakout strategy effectively?
This strategy can be effective by combining RSI indicators with volume analysis to confirm breakouts. Ensure you only enter trades when both confirm a strong move.
Crypto Breakout Scanner delivers real-time breakout alerts on Telegram the moment a coin breaks out — on 3m, 5m, and 15m timeframes. Join free and start catching breakouts instantly.
Keywords: Breakout Strategy, Trading Strategy, Technical Analysis, Risk Management
June 2026 Update: What's Changed
I've been watching the crypto market closely lately, and let me tell you, things have shifted. Bitcoin's sitting at $62,773 right now, down 2.17% in the last 24 hours. It's a bit shaky, considering just a few days ago it hit $64,275. Highs and lows like this keep traders on their toes. Here's the thing — if you're not paying attention to breakouts, you're missing out.
I've seen many traders get spooked by these dips, but if you use a solid crypto breakout scanner, you can time your entries better. Truth is, breakouts are still one of the best opportunities to grab profits. If you catch them right, you could easily ride a wave up while others panic. Just look at ETH’s recent moves. It danced around resistance levels before finally breaking through.
Honestly, the indicators I mentioned in the original piece are still pretty much gold. But don’t forget to adjust your settings based on what's happening now. Markets change, and so should your approach. With volatility like this, you need to be sharp. Don't just wait for breakout alerts; act on them.
You might wonder, is this the right time to buy? Well, it depends. If you believe in the long-term potential of crypto, then a small dip could be an opportunity. But remember, trading isn't just about jumping in headfirst. It’s about strategy. Keep watching those support and resistance levels. They tell a story.
Real talk: patience is key. A good breakout strategy combined with the right indicators will pay off. Just don’t get too greedy. Be smart, and you'll find your way through this market chaos.
Try our Breakout Terminal
Scanning the markets in real-time for high-probability volume and price action breakouts. Access the scanner for free.
Elena Rostova
Elena Rostova is a crypto analyst and trader specializing in breakout strategies and real-time market signals. With years of experience in the space, they bring unique insights to the Crypto Breakout Scanner community.