Breakout Trading Psychology: Crypto Mistakes to Avoid
Breakout Trading Psychology: Crypto Mistakes to Avoid
When you're in the thick of breakout trading, the psychological hurdles can be as challenging as the technical ones. In this article, we’ll explore the common mistakes traders make due to psychological pitfalls and how to avoid them. This isn't just about understanding charts; it’s about mastering your mind.
What is a Breakout?
A breakout occurs when the price of a cryptocurrency moves beyond a defined support or resistance level, typically accompanied by increased volume. This can signal the start of a new trend, offering traders an opportunity to capitalize on price movements. Breakouts can be bullish (upward) or bearish (downward), depending on the direction of the price movement. For breakout traders, recognizing these moments is crucial. The goal is to identify valid breakouts and avoid the traps set by false signals.
Real Trading Example
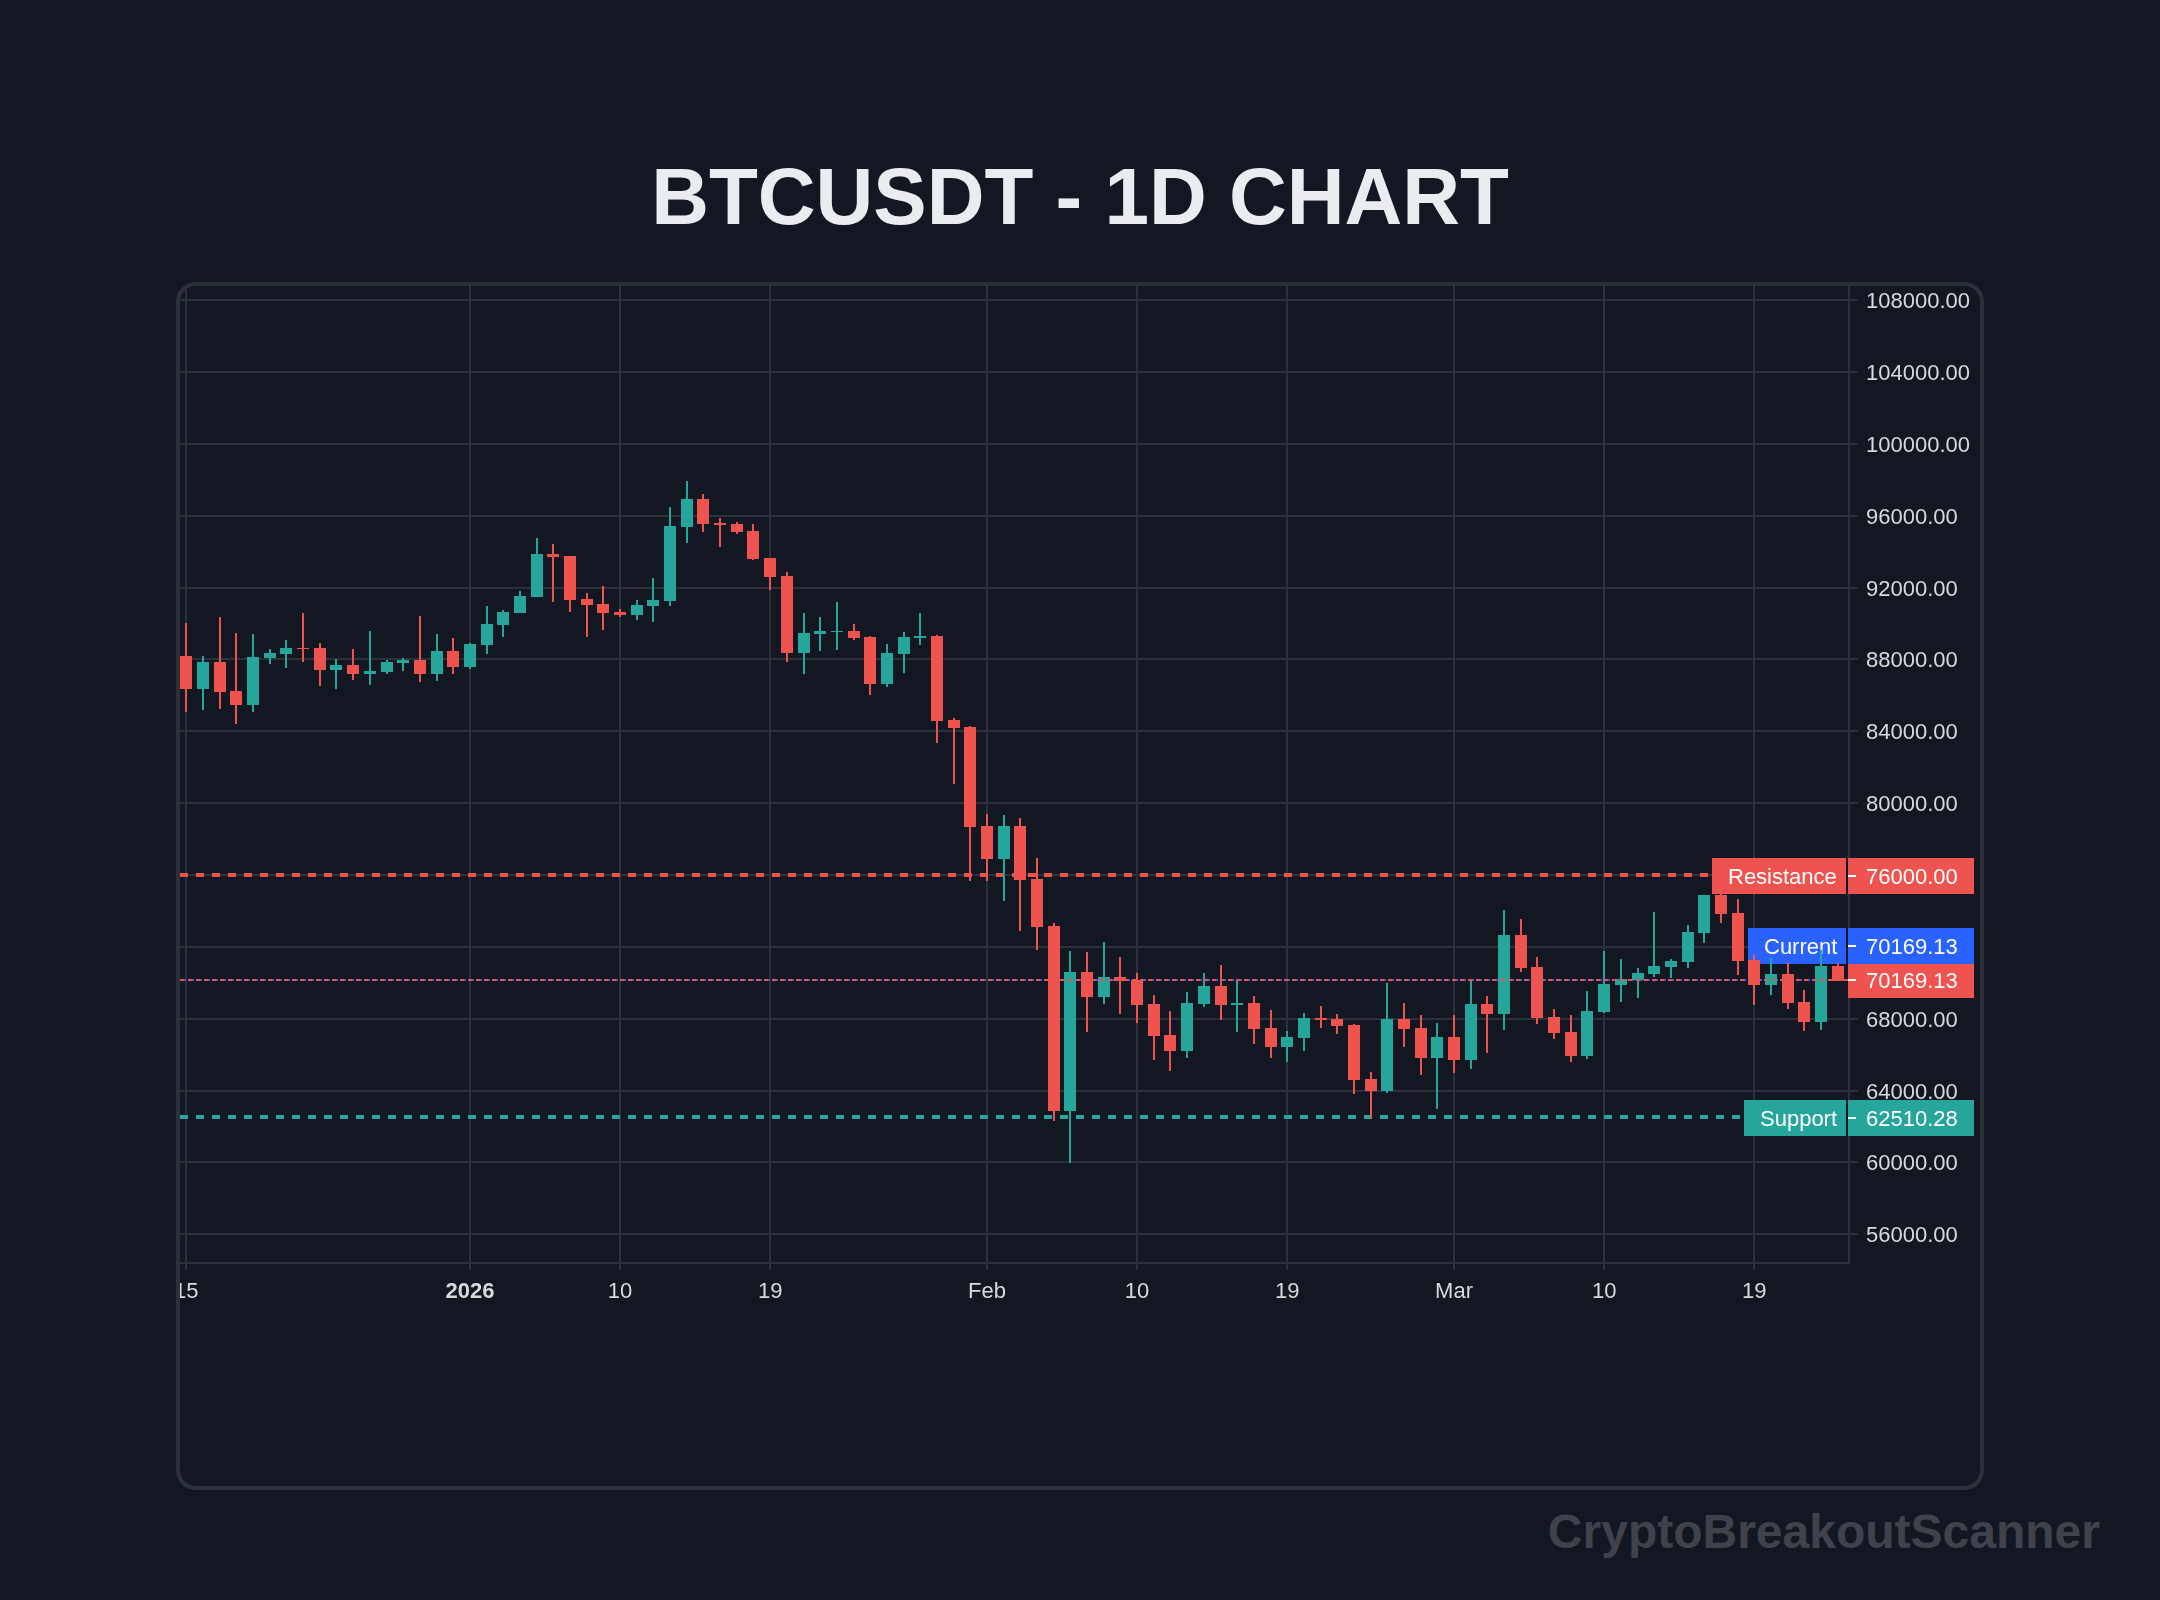
Let’s dig into a recent breakout example using Bitcoin (BTC). On March 20, 2026, Bitcoin was trading at $68,500. After weeks of consolidation around $67,000, BTC broke through the $68,800 resistance level. The breakout was accompanied by strong buying volume, confirming a bullish move. Within 48 hours, Bitcoin surged to $71,000, offering traders significant profits if they acted on the breakout signal.
Traders using a crypto breakout scanner would have received an alert about this move, providing them with the opportunity to enter before the price skyrocketed. Timing is everything in the world of breakouts, and having the right tools can make a difference.
Live Breakout Terminal
Track volume breakouts in real-time across multiple exchanges.
Confirmation Indicators
After identifying a breakout, it’s essential to confirm it through various indicators to ensure it's not a false signal. Here are key indicators to watch:
- Relative Strength Index (RSI): Look for an RSI above 50. This indicates bullish momentum. An RSI below 30 might suggest an oversold condition, which could lead to false breakouts.
- Volume: Ideally, you want to see volume at least 1.5 times the average for the past 20 days. Higher volume confirms that the breakout is backed by significant market interest.
- Price Structure: Analyze the price action after the breakout. If the price retraces but stays above the breakout level, that’s a positive sign. Conversely, if it falls back below the breakout point, it could indicate a fakeout.
Fake Breakout Detection
Fakeouts can be costly. A fake breakout happens when the price moves above resistance or below support but quickly reverses. Here’s how to spot them:
- Wicks: Look for long wicks on candlesticks that suggest the price was rejected at resistance or support levels.
- Volume Divergence: If the breakout occurs on lower volume than expected, it raises a red flag. True breakouts should have strong volume behind them.
- Key Tests: Watch for key support or resistance levels being tested again after a breakout. If the price fails to hold above resistance or below support, it may indicate a false breakout.
For a deeper dive into identifying these pitfalls, check out our fake breakout detection guide.
Risk Management Formula
Effective risk management is crucial to your success as a breakout trader. Here’s a simple formula to determine your position size:
-
Determine your account risk: Decide how much of your account you are willing to risk on a single trade (commonly 1%).
-
Calculate your stop-loss distance: Identify the distance from your entry point to your stop-loss level.
-
Position Size Calculation:
Risk = Account Balance × Risk Percentage Position Size = Risk / Stop-Loss Distance
For example, if your account balance is $10,000 and you are risking 1%, your risk is $100. If your stop-loss is set at $500 below your entry point, your position size would be:
Position Size = $100 / $500 = 0.2 BTC
This ensures you’re not overexposed on any single trade, which is essential for long-term success in breakout trading.
Step-by-Step Trading Approach
When you get a breakout signal from your crypto breakout screener, follow these steps:
- Verify the Breakout: Check your confirmation indicators (RSI, volume, price action).
- Set Entry Point: Plan your entry. Consider entering at the breakout point or waiting for a pullback.
- Determine Stop-Loss: Set your stop-loss based on your risk management strategy. Place it just below the breakout level.
- Define Profit Target: Decide on a profit target based on previous resistance levels or a risk-reward ratio (e.g., 2:1).
- Monitor the Trade: Watch the price action closely. Adjust your stop-loss to secure profits if the trade moves in your favor.
- Exit Strategy: Have a clear exit strategy. Don't let emotions drive your decisions.
- Review Your Trade: After closing the trade, analyze what worked and what didn’t.
This structured approach helps mitigate the psychological pitfalls common in breakout trading.
FAQ
What are the most common psychological mistakes in breakout trading?
Common mistakes include FOMO, overtrading, and chasing after prices without confirmation. These errors can lead to significant losses.
How do I avoid FOMO when trading breakouts?
Stay disciplined. Stick to your trading plan and only act on confirmed signals from your crypto breakout scanner.
What is the impact of overtrading on my account?
Overtrading can quickly deplete your account due to increased transaction fees and emotional decision-making. Avoid it by adhering to a strict trading plan.
How can I improve my trading discipline?
Establish clear rules for when to enter and exit trades. Use a crypto breakout alert system to help maintain discipline.
What indicators can help confirm a breakout?
Key indicators include RSI, volume analysis, and support and resistance levels. Each plays a vital role in validating breakouts.
How do I set realistic profit targets for breakout trades?
Identify previous resistance levels and use a risk-reward ratio of at least 2:1 to set realistic profit targets. This balances potential profit against risk.
Can I trade breakouts without a scanner?
While it’s possible to trade breakouts manually, a crypto breakout screener makes the process more efficient by providing real-time alerts on potential breakouts.
What should I do if my breakout trade fails?
If a trade fails, stick to your exit strategy. Analyze the reasons behind the failure to improve future trades.
Crypto Breakout Scanner delivers real-time breakout alerts on Telegram the moment a coin breaks out — on 3m, 5m, and 15m timeframes. Join free and start catching breakouts instantly.
Keywords: Breakout Strategy, Trading Strategy, Risk Management, Technical Analysis
June 2026 Update: What's Changed
I've been watching the market closely this month. Bitcoin is sitting at $61,584, down about 1.53% in the last 24 hours. Not a huge drop, but enough to make you think twice about your strategy. Truth is, we’re caught in a messy phase where the market’s been testing support and resistance levels like a hyper kid on a trampoline.
Look — if you’re trading breakouts, you'll need to stay sharp. The volatility isn’t over. In the past few weeks, I’ve seen some wild swings. Just last week, we hit a high of $63,239 before dipping down to $59,103. It’s a trader's playground, yet it’s also a minefield for those who haven’t got their psychology in check.
Here’s the thing — many traders chase after these breakouts without having a solid plan. They rely too much on crypto breakout scanners or leave their breakout alerts to do the thinking for them. You can’t just sit back and let tech handle it; you’ve got to be ready to adapt. It’s not just about the charts; it’s about how you handle the pressure. I’m telling you, being patient during these dips is tougher than it sounds.
Honestly, when I see a breakout starting to form, I remind myself to wait. Jumping in too soon can be a costly mistake. Ask yourself: Am I reacting or responding? That small difference can save you from a nasty loss. Real talk: if you’re not prepared for the emotional rollercoaster, it’s best to keep your money on the sidelines.
So, what’s my game plan? I’m waiting for a clear pattern to emerge. I’m looking for volume and price action to confirm a breakout before I make my move. This market isn't playing nice. Stick to your trading rules. The market will always be there, but your capital and mindset won’t be as forgiving.
Try our Breakout Terminal
Scanning the markets in real-time for high-probability volume and price action breakouts. Access the scanner for free.
David Park
David Park is a crypto analyst and trader specializing in breakout strategies and real-time market signals. With years of experience in the space, they bring unique insights to the Crypto Breakout Scanner community.