Breakout Trading Risk Management Formula Crypto
Breakout Trading Risk Management Formula Crypto
When diving into breakout trading in the crypto world, understanding risk management isn't just an option; it's a necessity. Breakout trading focuses on capturing significant price movements once an asset surpasses established resistance levels. But to succeed, you need a solid risk management formula that ensures you can withstand losses while maximizing profits. Let’s break down the process, focusing on the critical components of risk management in breakout trading.
What is a Breakout?
In trading terms, a breakout occurs when the price of an asset moves beyond a defined level of support or resistance. In simpler words, it’s that moment when the price breaks out of its range and heads in a new direction. This can lead to significant price movements, making it a prime opportunity for traders.
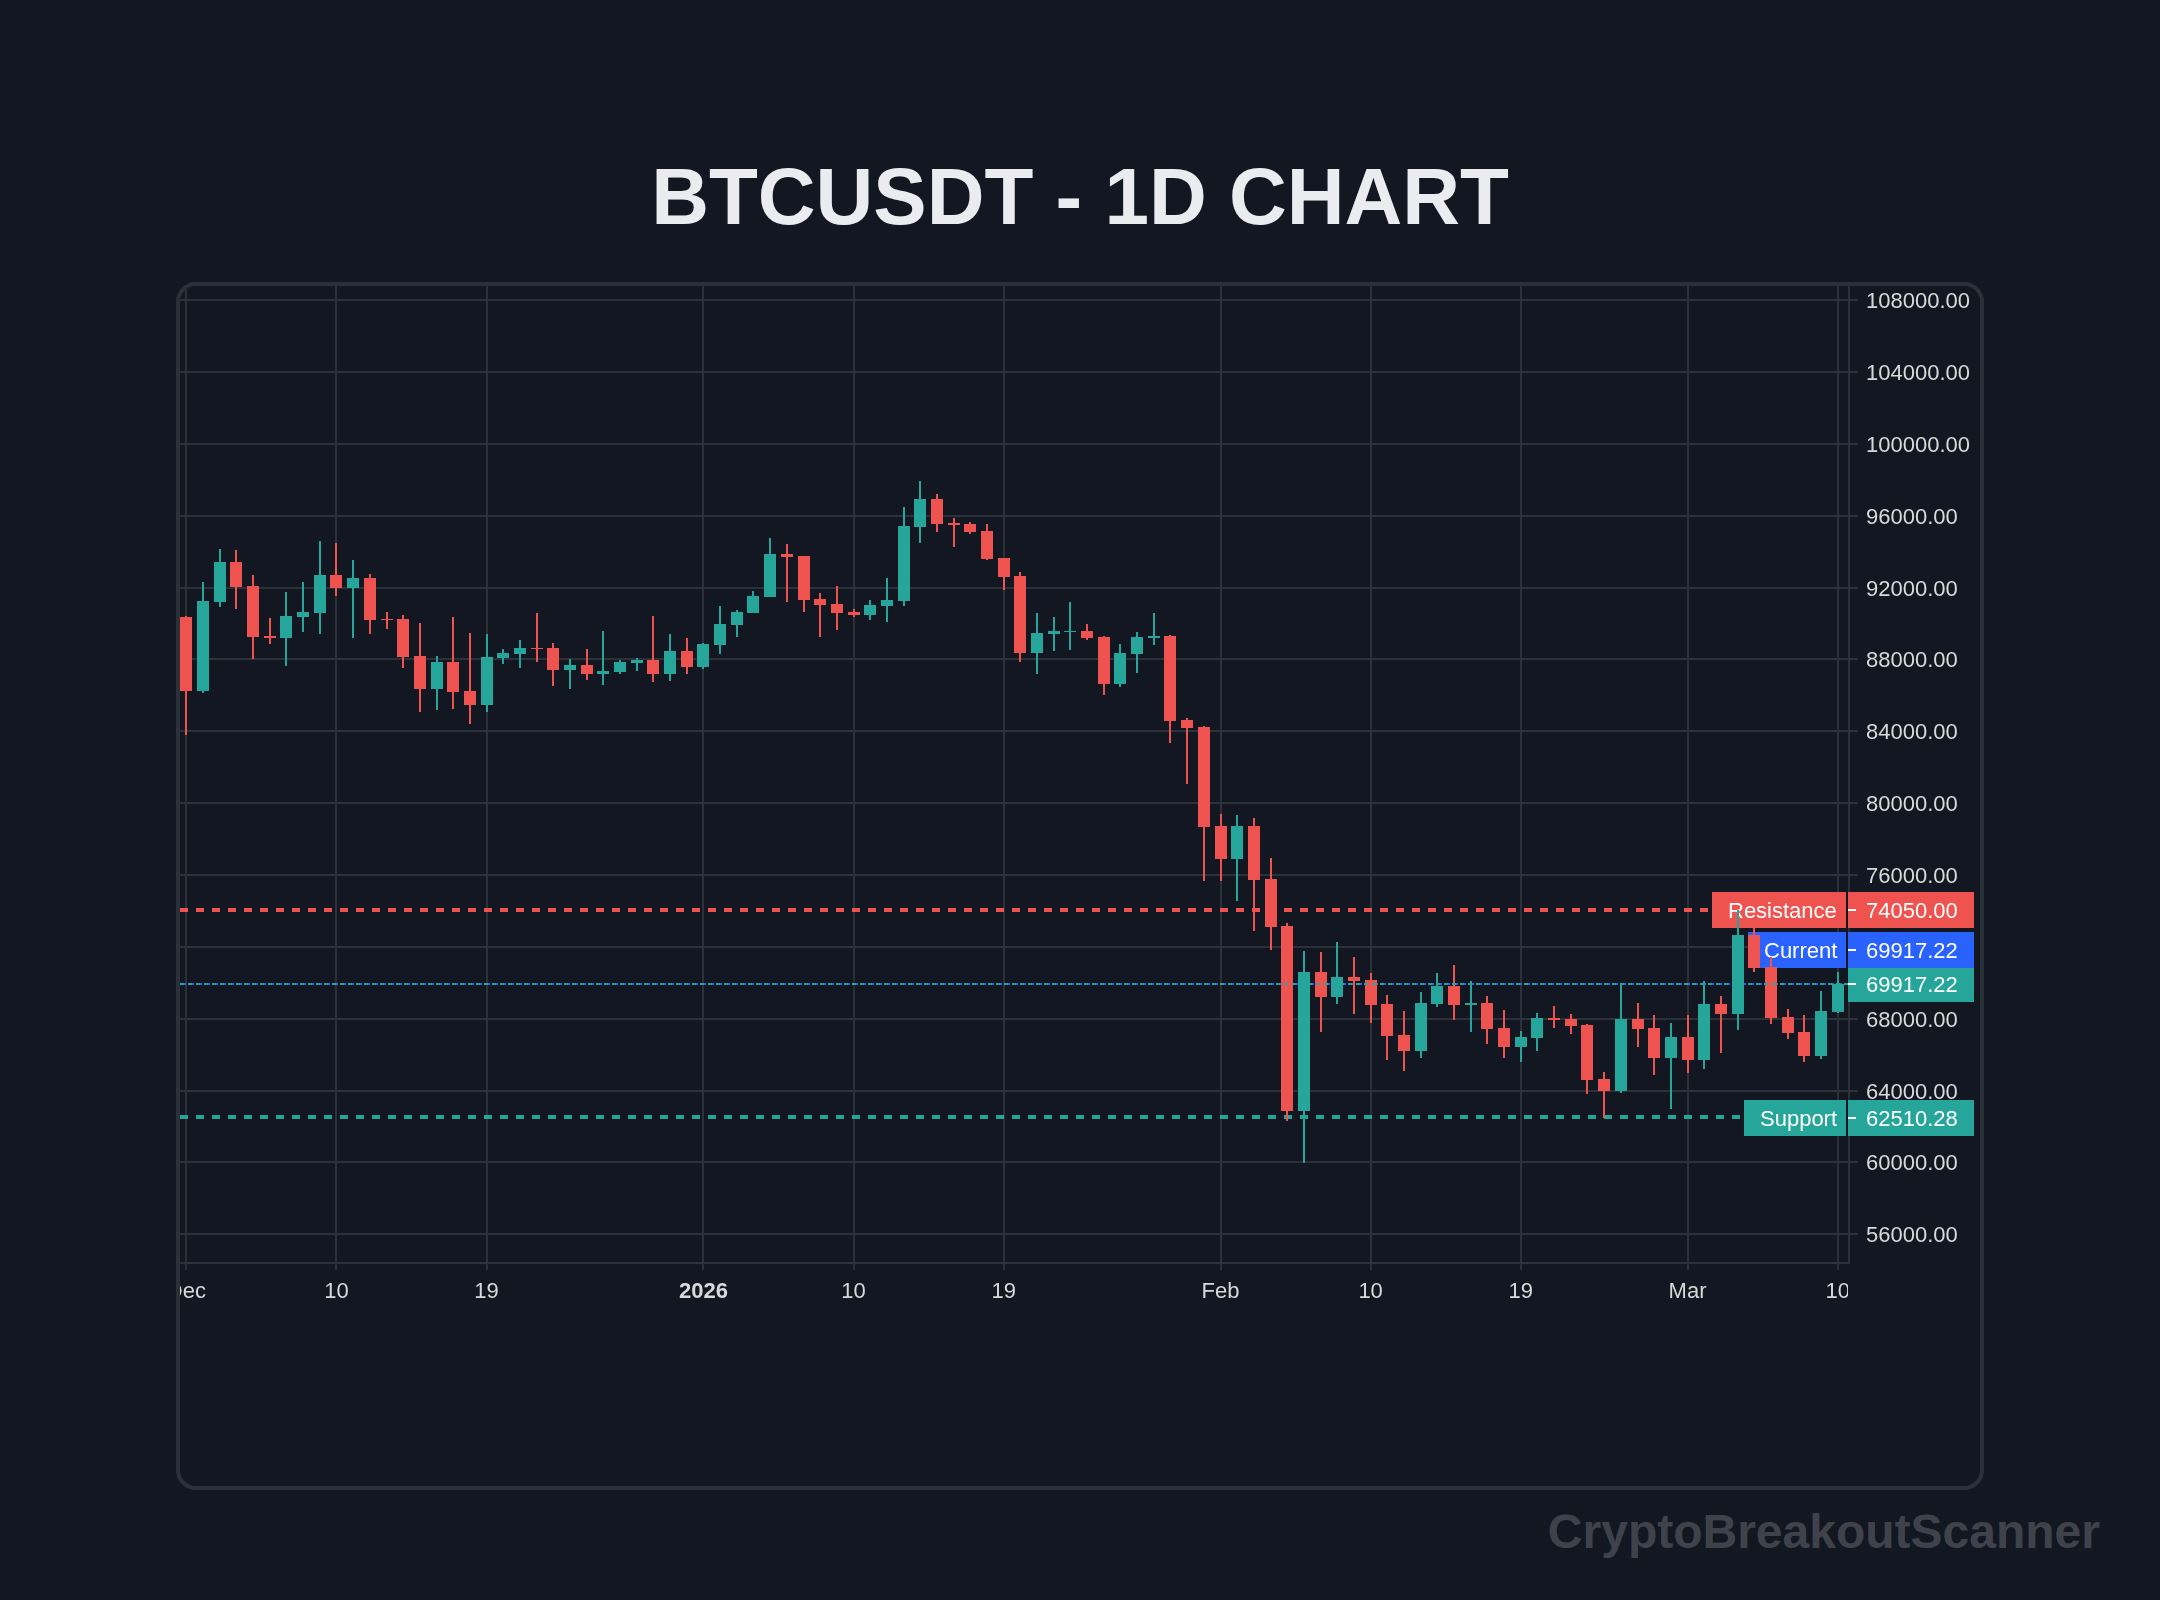
Consider Bitcoin (BTC) recently trading at $69,913. It pushed past a resistance level of $68,000, leading to a surge. Traders who identified this breakout could capitalize on the price increase, but only if they managed their risks appropriately.
Real Trading Example
Let’s look at a real-world example involving Bitcoin.
On February 20, 2026, BTC was trading at around $67,500, consolidating in a tight range for several days. Traders observed a breakout when the price surged past $68,000 with strong volume. The breakout confirmed a bullish trend, and BTC climbed to $70,000 within days. This scenario showcases how critical it is to identify breakout points, but it also emphasizes the importance of a robust risk management strategy.
Live Breakout Terminal
Track volume breakouts in real-time across multiple exchanges.
Confirmation Indicators
To validate a breakout, traders often rely on several confirmation indicators. Here are the key ones:
- Relative Strength Index (RSI): Look for the RSI to be above 50, indicating bullish momentum. An RSI above 70 may suggest overbought conditions, so use caution.
- Volume: A breakout should be accompanied by volume at least 1.5 times the average volume for that asset. This indicates strong buying interest and confirms the breakout.
- Price Structure: Evaluate the price action. A clean break above resistance without significant retracement solidifies the breakout’s validity.
By using these indicators, traders can refine their entries and exits, enhancing their success rate.
Fake Breakout Detection
Even seasoned traders face the risk of fakeouts. A fake breakout occurs when the price briefly breaches a support or resistance level but then reverses, leading to losses for unprepared traders. Here’s how to spot them:
- Wicks: Watch for long wicks on candlesticks. If a breakout candle closes significantly below the breakout level, it may signal a fakeout.
- Volume Divergence: If the breakout occurs on low volume, be cautious. A lack of volume can indicate weak conviction in the move.
- Key Tests: After a breakout, if the price quickly retraces back to the breakout point and tests it as resistance, it could indicate a potential fakeout.
Refer to the fake breakout detection guide for more detailed strategies on avoiding these traps.
Risk Management Formula
Proper risk management is the backbone of successful breakout trading. One widely accepted formula is:
Risk = Account Size × Risk Percentage
For example, if your account size is $10,000 and your risk percentage is 1%, your risk is $100.
Now, let’s explore how to determine stop loss placement:
- Identify Entry Point: This is based on your breakout confirmation.
- Determine the Stop Loss: Place your stop loss at a level that protects your capital, typically below the breakout point. For instance, if BTC breaks out at $68,500, consider placing your stop loss at $67,800.
- Calculate Position Size: Using the formula, determine how many units you can trade without exceeding your risk tolerance. If BTC is currently $68,500 and your stop loss is $700 away, you can risk 0.14 BTC on this trade ($100/$700).
This structured approach helps maintain emotional discipline and protects your trading account.
Step-by-Step Trading Approach
Once you receive a breakout signal, follow these steps:
- Verify the Breakout: Check that you have confirmation indicators aligned (RSI, volume, price structure).
- Set Your Entry Point: Identify where you will enter the trade based on the breakout.
- Establish Stop Loss and Take Profit Levels: Define your stop loss below the breakout point and set a take profit target at a ratio of at least 2:1 compared to your risk.
- Calculate Position Size: Use the risk management formula to determine how much to trade.
- Execute the Trade: Enter the trade with your predefined parameters.
- Monitor the Trade: Watch for any signs of reversal or volatility that could affect your position.
- Adjust Stop Loss: As the trade moves in your favor, consider moving your stop loss to break-even or locking in profits.
By following a systematic approach, you can enhance your chances of success in breakout trading.
FAQ Section
What is the best breakout trading strategy?
The best strategy involves using confirmation indicators like RSI and volume alongside a crypto breakout scanner for real-time alerts.
How do I set stop losses for breakouts?
Set stop losses just below the breakout point, ensuring you limit your losses if the breakout fails.
What percentage of my account should I risk on a trade?
A common guideline is to risk no more than 1% to 2% of your total trading account on a single trade.
How do I identify fake breakouts?
Look for wicks, low volume during breakouts, or immediate retests of the breakout level that fail to hold.
Which indicators are best for breakout trading?
The most effective indicators are RSI, volume analysis, and price action patterns. Combine these for robust decision-making.
Can I automate my breakout alerts?
Yes! Using a crypto breakout scanner can automate alerts and help you catch breakouts in real-time.
How often should I check for breakouts?
Stay engaged but don’t obsess. Check your crypto breakout screener regularly, ideally at the start of each trading session.
What are some common mistakes in breakout trading?
Common mistakes include not using proper risk management, failing to confirm breakout signals, and overtrading.
Crypto Breakout Scanner delivers real-time breakout alerts on Telegram the moment a coin breaks out — on 3m, 5m, and 15m timeframes. Join free and start catching breakouts instantly.
Keywords: Breakout Strategy, Risk Management, Trading Strategy, Technical Analysis
June 2026 Update: What's Changed
I've been watching the crypto market closely this month. Right now, Bitcoin's trading at $63,985, which is a solid 1.69% gain in the last 24 hours. Not too shabby, right? But here's the thing — while some folks are riding that wave, I can’t help but feel a bit cautious.
Look — the market’s been volatile. Just last week, we saw Bitcoin hit a high of $64,388 before dipping down to $62,917. That’s a big swing! If you’re using the breakout trading strategy, you need to have a plan. Breakout alerts are crucial during these moments. If you’re not getting them, you might miss out on those critical price movements.
Real talk: it’s all about managing your risk here. You don't want to be that trader who hopes for the best without a proper safety net. Set your stop-loss orders wisely. Aim to protect your capital. Remember, every time you enter a trade, you should know where you’ll exit if things go south.
Honestly, I've noticed some traders getting too confident in this bullish trend. I get it. It's easy to feel invincible when prices are rising. But don't let greed blind you. If Bitcoin breaks above $64,000, that could signal a great opportunity. But if it falls below that $62,000 mark, you need to be ready to pull the trigger on your exit strategy.
Truth is, a solid crypto breakout scanner can make a world of difference. I've found it helps me stay ahead of moves I might miss otherwise. In this market, timing is everything.
So, what’s the bottom line? Use your risk management formula. Keep it simple. Be prepared for the ups and downs. Breakout trading isn’t just about catching the highs; it’s about staying profitable in the long run. And with prices like these, you’ve got to play it smart.
Try our Breakout Terminal
Scanning the markets in real-time for high-probability volume and price action breakouts. Access the scanner for free.
Sarah Chen
Sarah Chen is a crypto analyst and trader specializing in breakout strategies and real-time market signals. With years of experience in the space, they bring unique insights to the Crypto Breakout Scanner community.