Crypto Consolidation Pattern Breakout Explained
Crypto Consolidation Pattern Breakout Explained
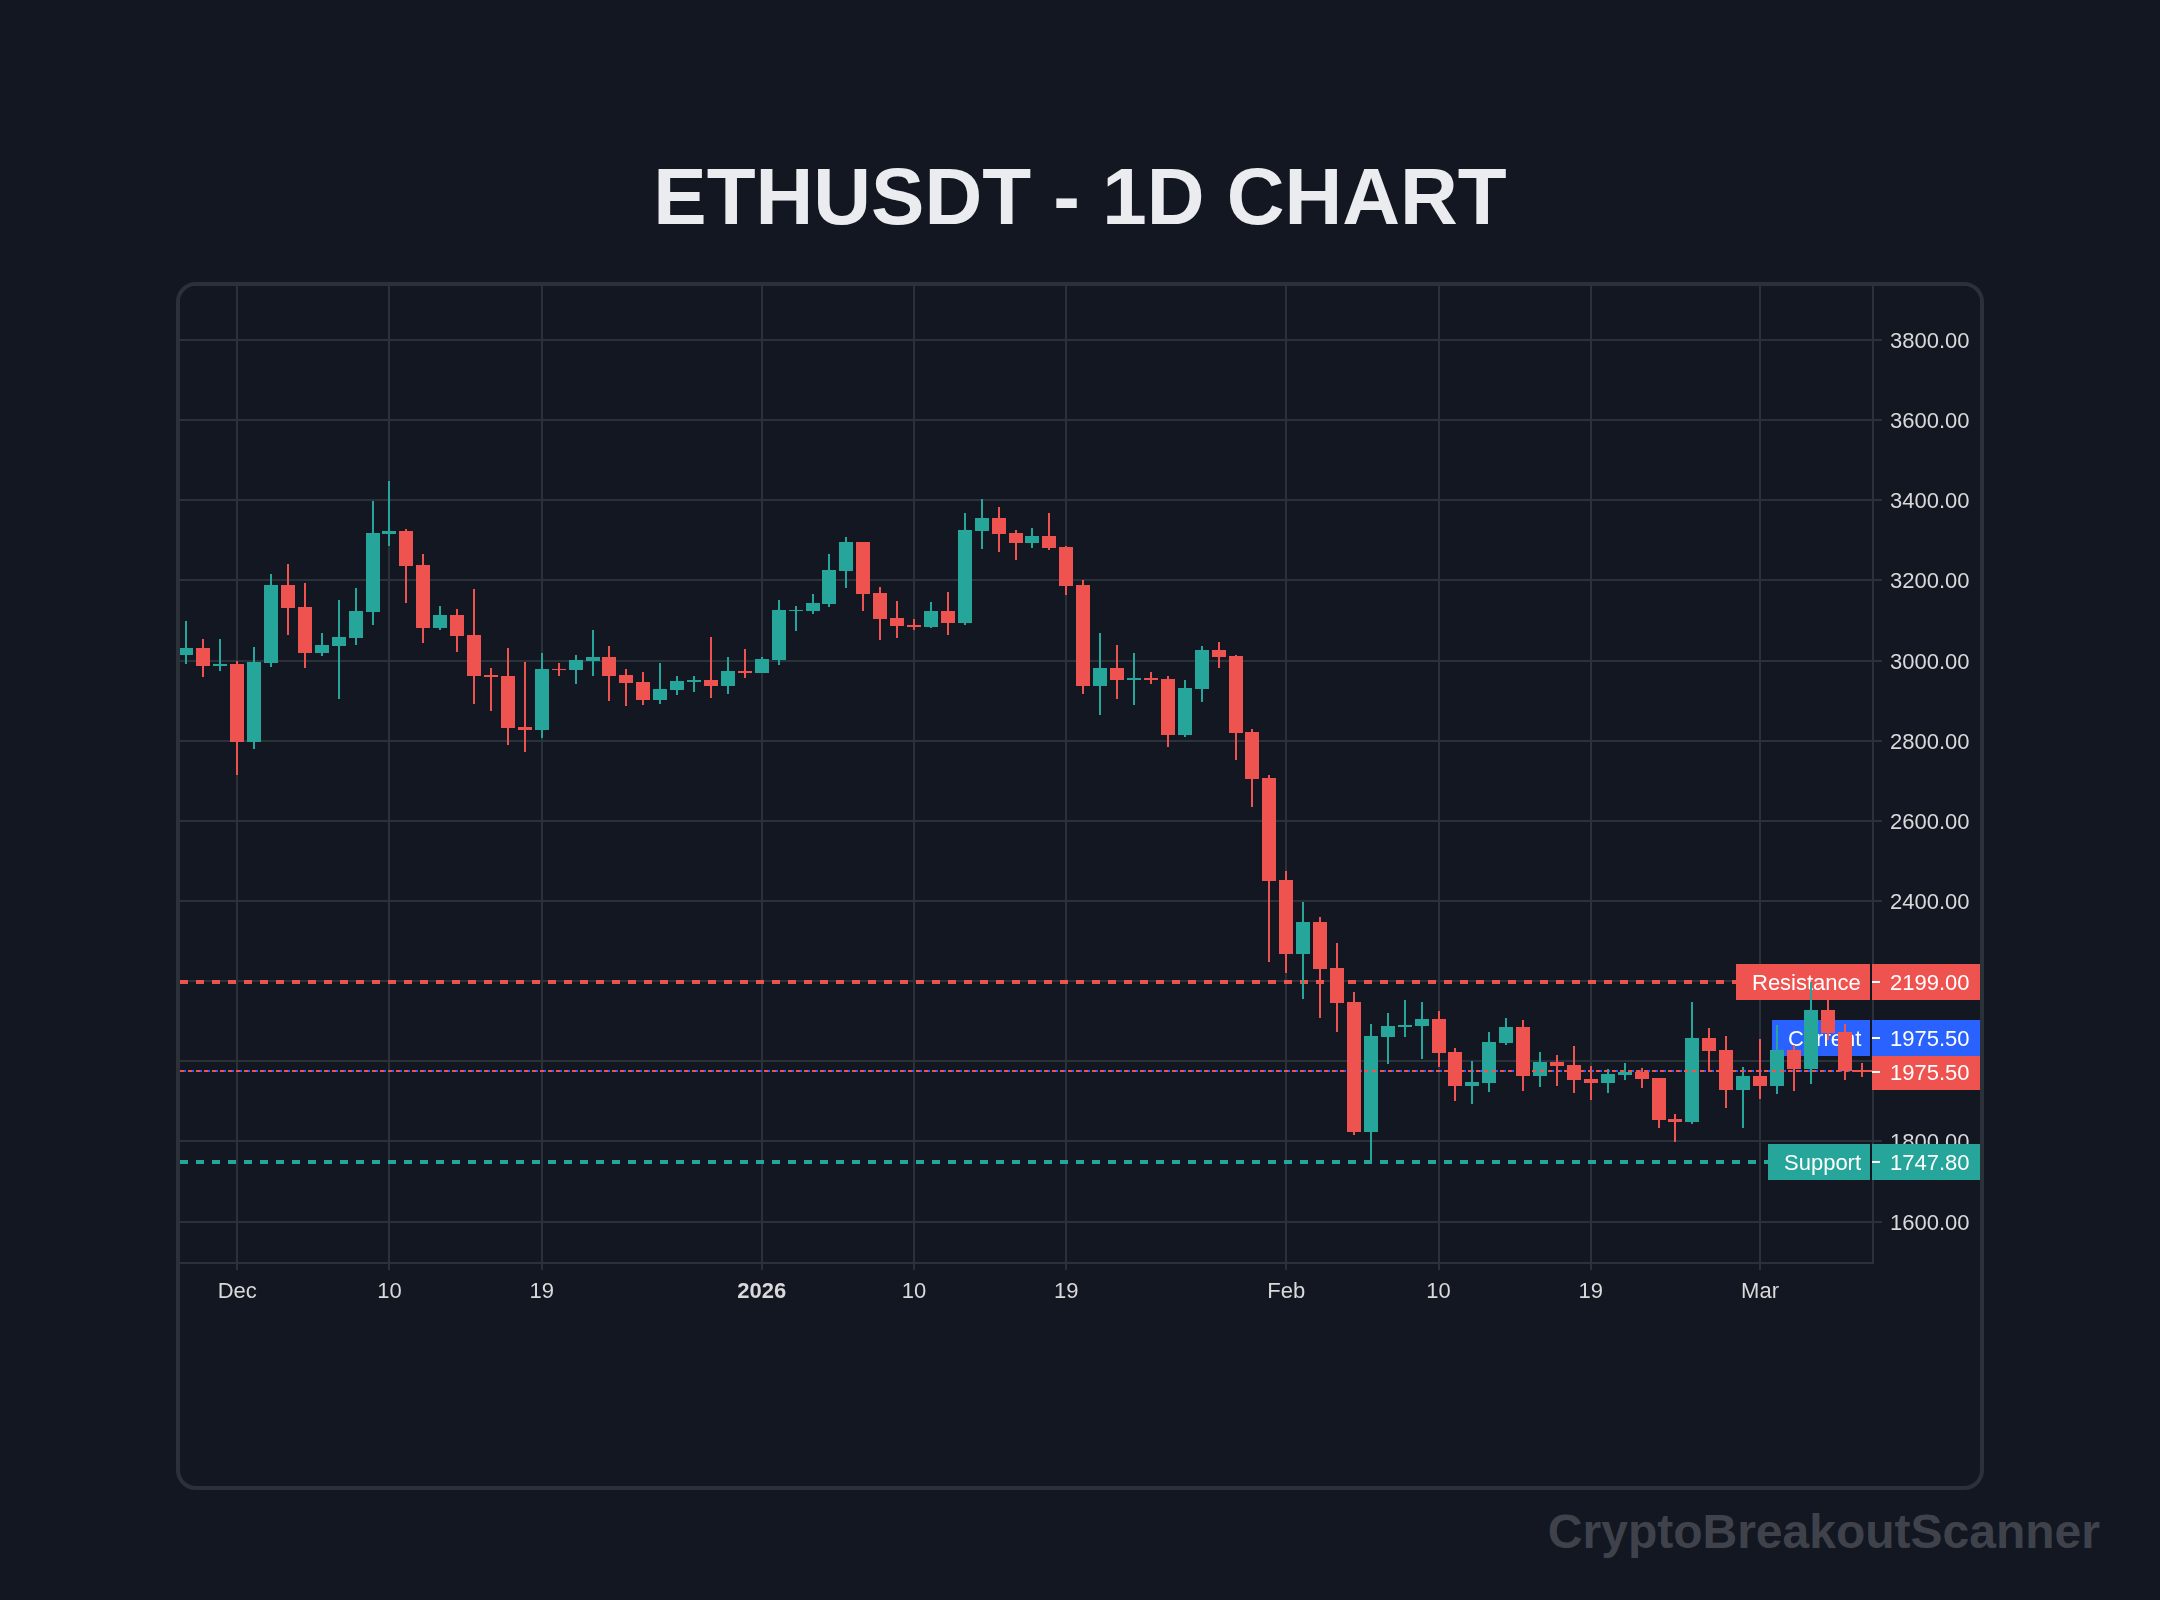
Trading breakouts effectively hinges on understanding consolidation patterns. Whether you're looking at rectangles, pennants, or flags, recognizing these formations can dramatically improve your trading outcomes. Let’s dissect what a breakout is in this context, explore real-world examples, and equip you with the skills to identify and capitalize on these trades.
What is a Breakout?
A breakout occurs when the price of an asset moves beyond a defined level of support or resistance. In the case of consolidation patterns, this typically follows a period of sideways movement where the price oscillates within a specific range. When the price finally escapes this range, it signals a potential shift in market sentiment, leading to a substantial price move.
Understanding breakouts is crucial because they can set the stage for significant price changes. As a trader, identifying these moments can lead to profitable trades.
Real Trading Example: ETH Consolidation
Let’s look at a recent example with Ethereum (ETH). Over a span of two weeks, ETH traded between $3,000 and $3,300, forming a rectangle consolidation pattern. During this period, the market sentiment was neutral, with neither buyers nor sellers gaining a decisive advantage.
On February 25, 2026, ETH broke out above the upper boundary at $3,300. The breakout was confirmed with a spike in volume, reaching 1.7 times the average volume for the past week, indicating strong buying interest. Within 48 hours, ETH surged to $3,700, showcasing the power of a well-timed breakout.
Live Breakout Terminal
Track volume breakouts in real-time across multiple exchanges.
Confirmation Indicators
To ensure the breakout is genuine, traders should rely on confirmation indicators. Here are the key metrics to examine:
- RSI (Relative Strength Index): Look for the RSI to be above 50 at the time of the breakout. This suggests bullish momentum.
- Volume: A breakout is more credible if it occurs on higher-than-average volume. Aim for at least 1.5 times the average volume.
- Price Structure: Confirm that the price closes above the breakout level, not just peeking above it briefly. This solidifies the breakout.
Fake Breakout Detection
Not all breakouts lead to genuine price movements. Fakeouts can occur, where the price makes a false break above or below a consolidation level, only to revert back quickly. Here’s how to spot them:
- Wicks: Look for long wicks on candlesticks. If the price shoots above a resistance line but closes below it, that’s a warning sign.
- Volume Divergence: If the price breaks out but volume fails to increase significantly, it could indicate a lack of conviction behind the move.
- Key Tests: If the price breaks and then retests the breakout level without holding, it may revert back, triggering a fakeout.
Risk Management Formula
Managing risk is crucial in breakout trading. Here's a simple formula:
- Risk = Account Size × 1%
- Determine your position size using the formula:
- Position Size = Risk Amount / (Entry Price - Stop Loss Price)
When placing your stop loss, consider:
- Set it just below the breakout point for long positions to limit potential losses.
- Never risk more than 1% of your trading capital on a single trade—this is paramount for long-term success.
Step-by-Step Trading Approach
Upon receiving a breakout signal, follow these steps:
- Identify the Consolidation Pattern: Ensure the pattern is clear and well-defined.
- Check Confirmation Indicators: Is the RSI above 50? Is the volume high?
- Set Your Entry Point: Determine the breakout level (e.g., above the resistance line).
- Place a Stop Loss: Set just below the breakout point.
- Monitor Price Action: Watch how the price behaves post-breakout—look for confirmation.
- Take Profits: Decide on your exit strategy. You might use trailing stops or set specific profit targets based on risk-reward ratios.
- Review and Adjust: After the trade, analyze what went well and what didn’t to refine your approach.
FAQ
What is a crypto consolidation pattern?
A consolidation pattern occurs when the price moves sideways for a period, indicating indecision in the market before a potential breakout.
How can I identify a breakout?
Look for price movement beyond established support or resistance levels, confirmed by increased volume and favorable RSI readings.
What are the best breakout patterns to trade?
Common patterns include rectangles, flags, and pennants. Each has distinct characteristics that can indicate potential breakouts.
How do I set my stop loss in breakout trading?
Set your stop loss just below the breakout level for long positions, ensuring it’s tight enough to minimize losses while giving room for price fluctuation.
What should I do if I spot a fake breakout?
Consider exiting the trade if the price quickly reverts back to the previous range after a breakout, especially if confirmed by low volume.
How can a crypto breakout scanner help me?
A crypto breakout scanner can provide real-time alerts on potential breakouts, allowing you to react immediately to trading opportunities.
What’s the importance of volume in breakout trading?
Volume indicates the strength of a breakout. Higher volume suggests stronger conviction from traders, increasing the likelihood of a sustained move.
How do I measure the risk-reward ratio for breakout trades?
Calculate your potential profit against your risk. Aim for a minimum of 2:1 ratio; this means for every $1 risked, you should aim to make at least $2 profit.
Crypto Breakout Scanner delivers real-time breakout alerts on Telegram the moment a coin breaks out — on 3m, 5m, and 15m timeframes. Join free and start catching breakouts instantly.
Keywords: Breakout Strategy, Trading Strategy, Breakouts, Risk Management
September 2026 Update: What's Changed
I've been watching the crypto market closely, and let me tell you, things have definitely shifted. Right now, Bitcoin's sitting at $77,042, down 1.20% over the last 24 hours. It had a bit of a ride, hitting a high of $78,055. But here's the thing — the consolidation patterns we talked about? They're still really relevant.
Look — the market's been moving in these tight ranges recently. It’s classic behavior before a new trend kicks in. Real talk: if you’ve been using a crypto breakout scanner, you’ll notice how those patterns are forming again. You’ve got rectangles and flags popping up as traders get jittery. But here's the kicker: many are waiting for that solid breakout before jumping in.
Truth is, if you’re not paying attention now, you might miss out. Are you ready to act when Bitcoin breaks through $80,000? That’s a big psychological level. If it gets there, I expect a rush of breakout alerts will start pinging everywhere. Traders are just itching to jump on the momentum that follows.
I recently spotted a few altcoins tightening up in their ranges too. They might follow Bitcoin's lead if it decides to break out. It’s a tricky game — do you chase after those smaller coins, or do you stick with the king? Personally, I’m leaning toward Bitcoin for now; it just has that influence over the market.
In short, keep your eyes peeled. The crypto consolidation might just be the calm before the storm. If you play it right, those breakouts can be sweet. Don't sleep on this!
Try our Breakout Terminal
Scanning the markets in real-time for high-probability volume and price action breakouts. Access the scanner for free.
Elena Rostova
Elena Rostova is a crypto analyst and trader specializing in breakout strategies and real-time market signals. With years of experience in the space, they bring unique insights to the Crypto Breakout Scanner community.