Ethereum Breakout Case Study Trading Example
Ethereum Breakout Case Study Trading Example
Breakouts are a critical aspect of trading, especially in the volatile world of cryptocurrency. For traders, understanding the nuances of a breakout can mean the difference between profit and loss. In this article, we’ll dive deep into an Ethereum breakout case study, analyzing the consolidation phase leading up to the breakout and the trading strategies that can maximize your gains.
Breakout Definition Section
In trading, a breakout occurs when the price of an asset moves beyond a defined support or resistance level, usually accompanied by increased volume. This can signal the start of a new trend, either upward or downward. For Ethereum (ETH), breakouts are particularly significant due to its high liquidity and active trading community. A breakout can indicate a strong buying or selling interest and often leads to rapid price movements.
Why Focus on Breakouts?
- High Profit Potential: Breakouts can provide excellent risk-to-reward ratios.
- Momentum Trading: Traders can ride the momentum for quick gains.
- Market Sentiment: Breakouts often reflect shifts in market sentiment, making them valuable indicators.
Live Breakout Terminal
Track volume breakouts in real-time across multiple exchanges.
Real Trading Example
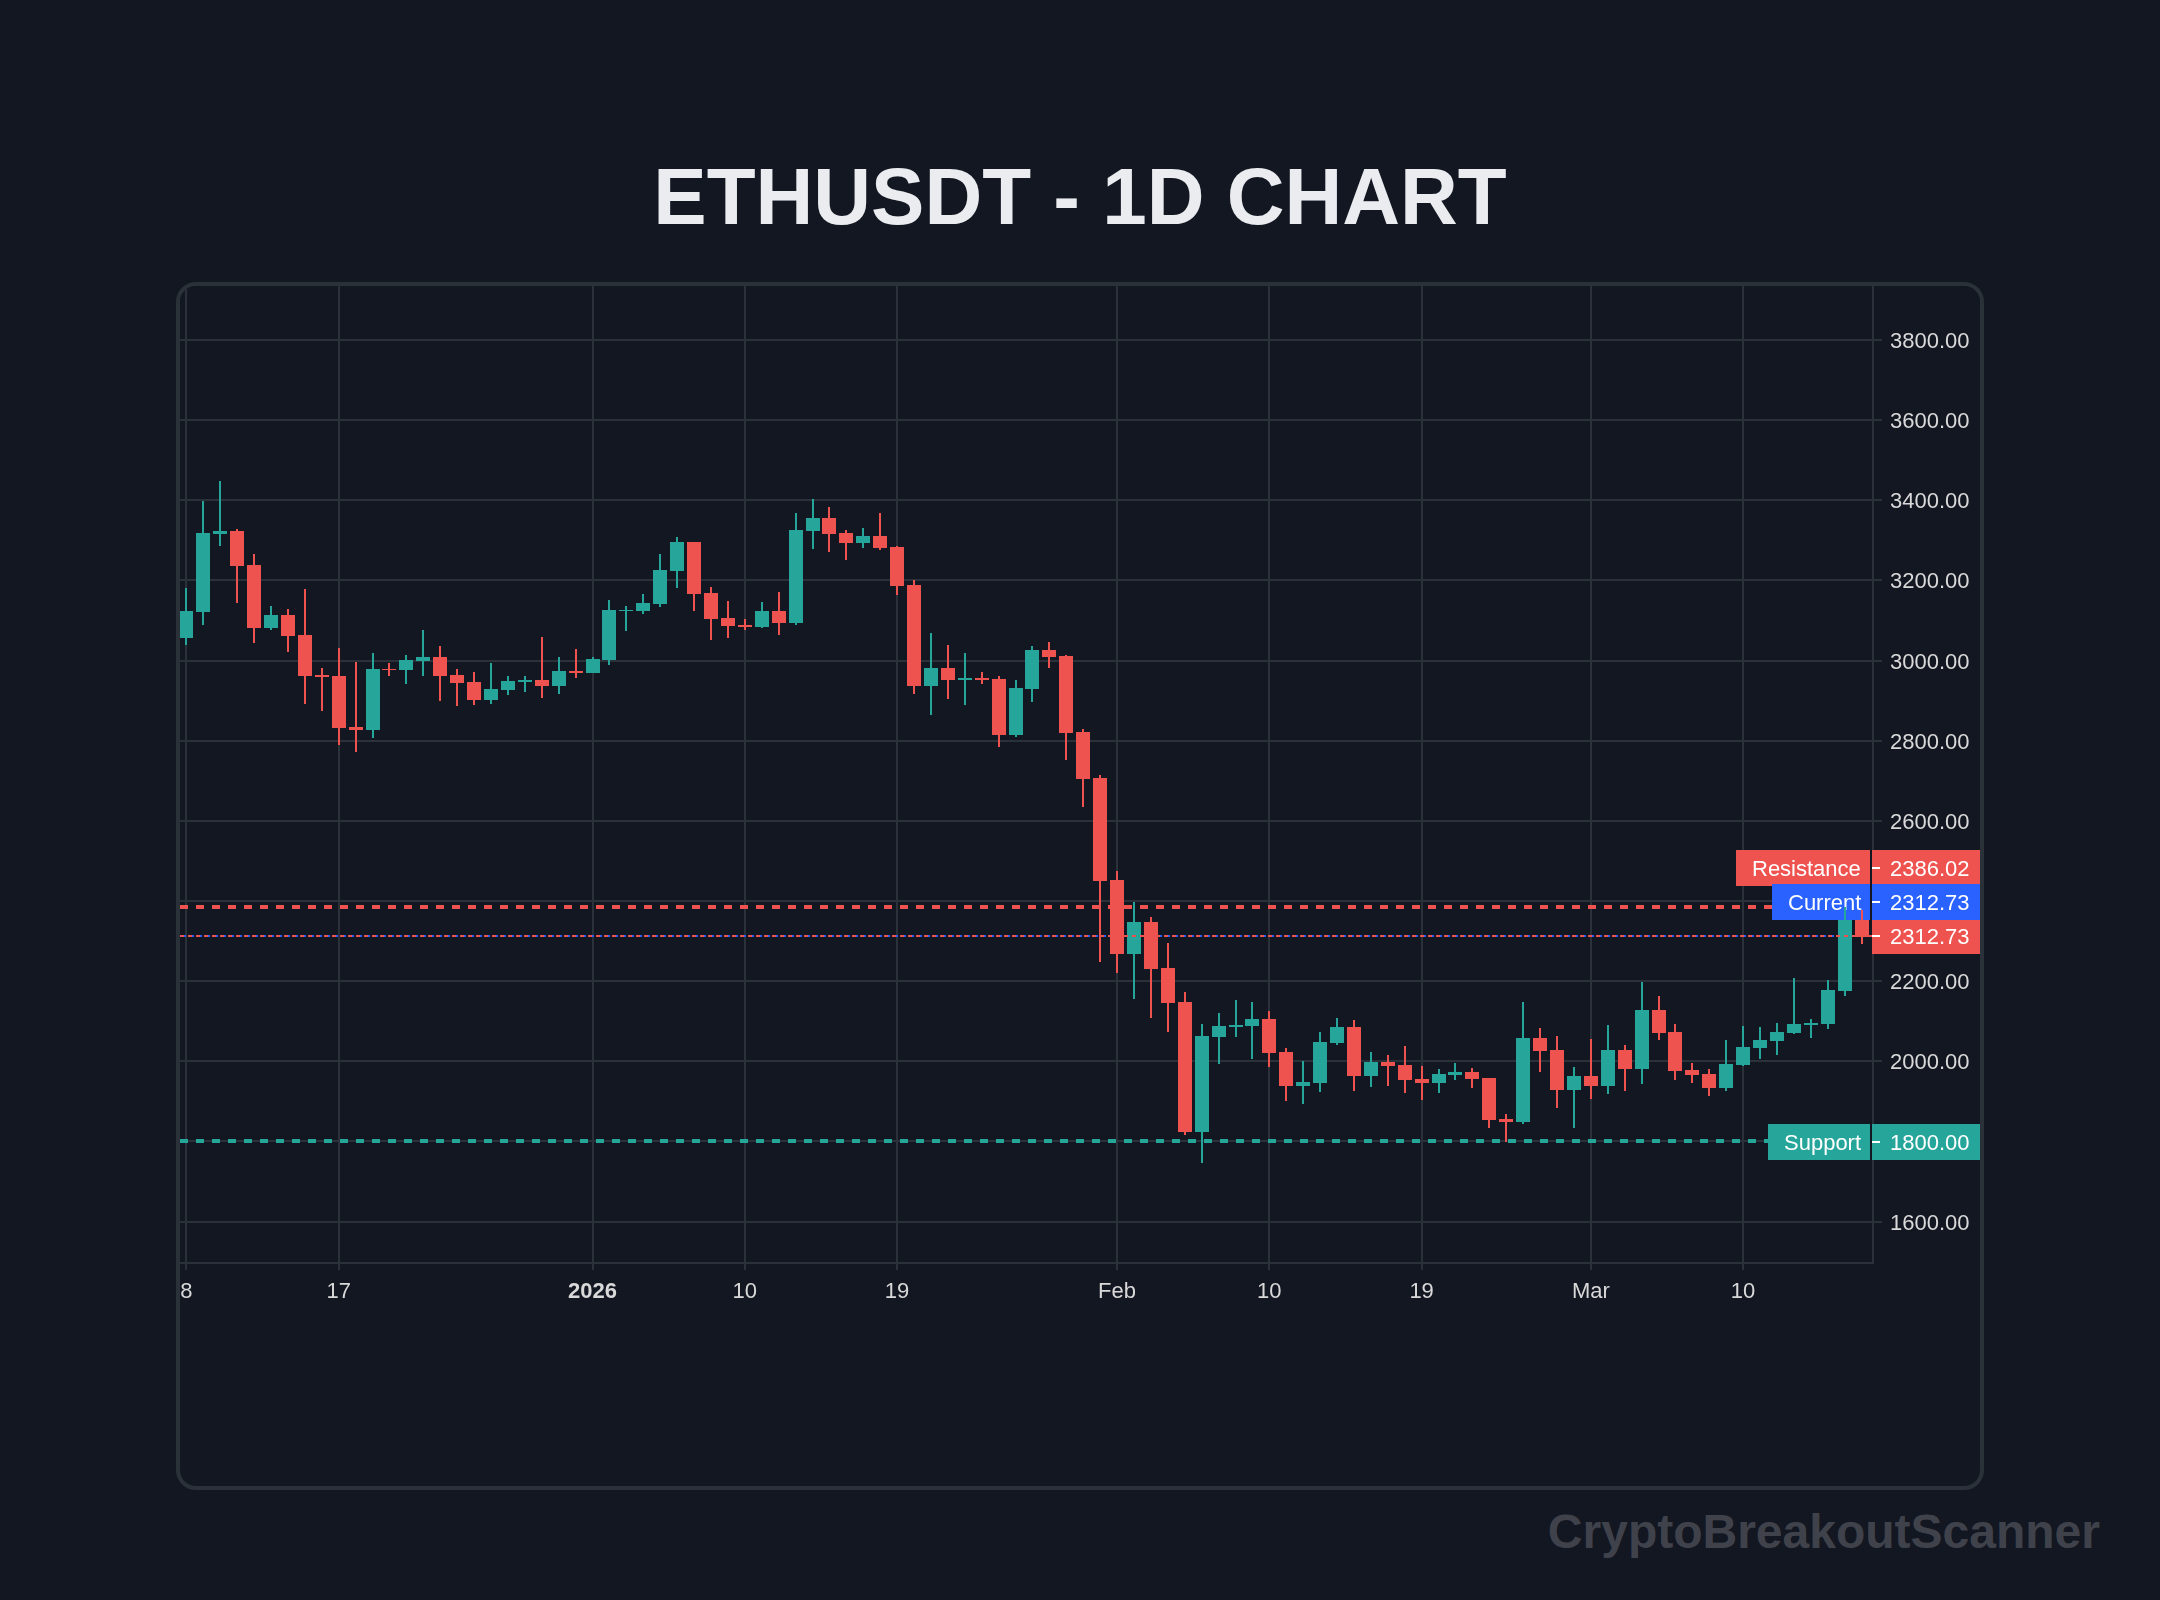
Let’s look at a real-world example of an ETH breakout that occurred recently. On February 12, 2026, Ethereum was trading within a consolidation range between $1,600 and $1,650, showing signs of indecision in the market. The 4-hour chart depicted a classic setup: price was bouncing off the support level while testing resistance consistently.
Key Price Levels:
- Support Level: $1,600
- Resistance Level: $1,650
On February 13, 2026, Ethereum broke above the resistance level at $1,650 with a surge in volume, closing the candle at $1,670. This breakout signaled a potential upward trend.
What Happened Next?
After the breakout, ETH experienced a quick rally, reaching a peak of $1,800 within three days before facing a pullback. This showcased the power of breakout trading when executed correctly, allowing traders who acted on the breakout signal to capitalize on the price movement.
Confirmation Indicators Section
Before jumping into a trade following a breakout, it's crucial to confirm the signal with reliable indicators. Here are the primary indicators to consider:
1. Relative Strength Index (RSI)
- Ideal Level: Look for RSI above 50 to confirm bullish momentum.
- Current Example: After the ETH breakout on February 13, the RSI surged to 65, indicating strong buying pressure.
2. Volume
- Volume Confirmation: A breakout should ideally be accompanied by volume at least 1.5 times the average volume.
- ETH Example: On the breakout day, the volume exceeded the average by 2x, signaling strong market interest.
3. Price Structure
- Higher Highs: After the breakout, traders should watch for higher highs and higher lows to confirm the new trend.
- Post-Breakout Action: ETH consistently made higher highs after the breakout, indicating a sustained upward movement.
Fake Breakout Detection Section
Not every breakout leads to a sustained trend; many turn out to be false breakouts or
Keywords: Breakout Strategy, Trading Strategy, Technical Analysis, Education
June 2026 Update: What's Changed
I've been watching the crypto scene pretty closely these days, and man, things are wild. Bitcoin's hanging around $64,174 right now, down a bit at -0.57%. With a 24-hour high of $65,623, it’s clear this market is still swinging. Look — we’ve seen some heavy volatility lately, which means breakouts are still your best friend if you know how to spot them.
Honestly, Ethereum’s been lagging a bit compared to Bitcoin lately, but that’s not all bad. There’s hype building again, and I’ve noticed some solid consolidation patterns. When you see that happening, it’s usually a sign that a breakout could be right around the corner. Truth is, a solid crypto breakout scanner can make all the difference here. You can catch those moves before everyone else does.
Here's the thing — if you’re not setting up your breakout alerts, you’re missing out. That’s how I’ve been catching these moves, and let me tell you, it pays off. Just recently, I spotted a clean breakout setup that shot ETH up nearly 8% in just a few hours. And if you’re waiting for perfect conditions, you might end up missing your chance.
Real talk: timing is everything. I always try to get in during those tighter consolidation phases. You know those moments when trading volume drops and price seems to hold steady? That’s when I’m ready to pull the trigger. And don’t forget, the trick is to have your stop-loss in place.
So, are you ready to jump on the next ETH breakout? Markets are unpredictable, but with the right tools and mindset, you’ll improve your odds. Start watching those key levels and keep your eyes peeled. The next opportunity could be just a trade away!
Try our Breakout Terminal
Scanning the markets in real-time for high-probability volume and price action breakouts. Access the scanner for free.
Sarah Chen
Sarah Chen is a crypto analyst and trader specializing in breakout strategies and real-time market signals. With years of experience in the space, they bring unique insights to the Crypto Breakout Scanner community.