Master Pricing Breakout Crypto for Solana Like a Pro
How to Price Breakout Crypto for Solana
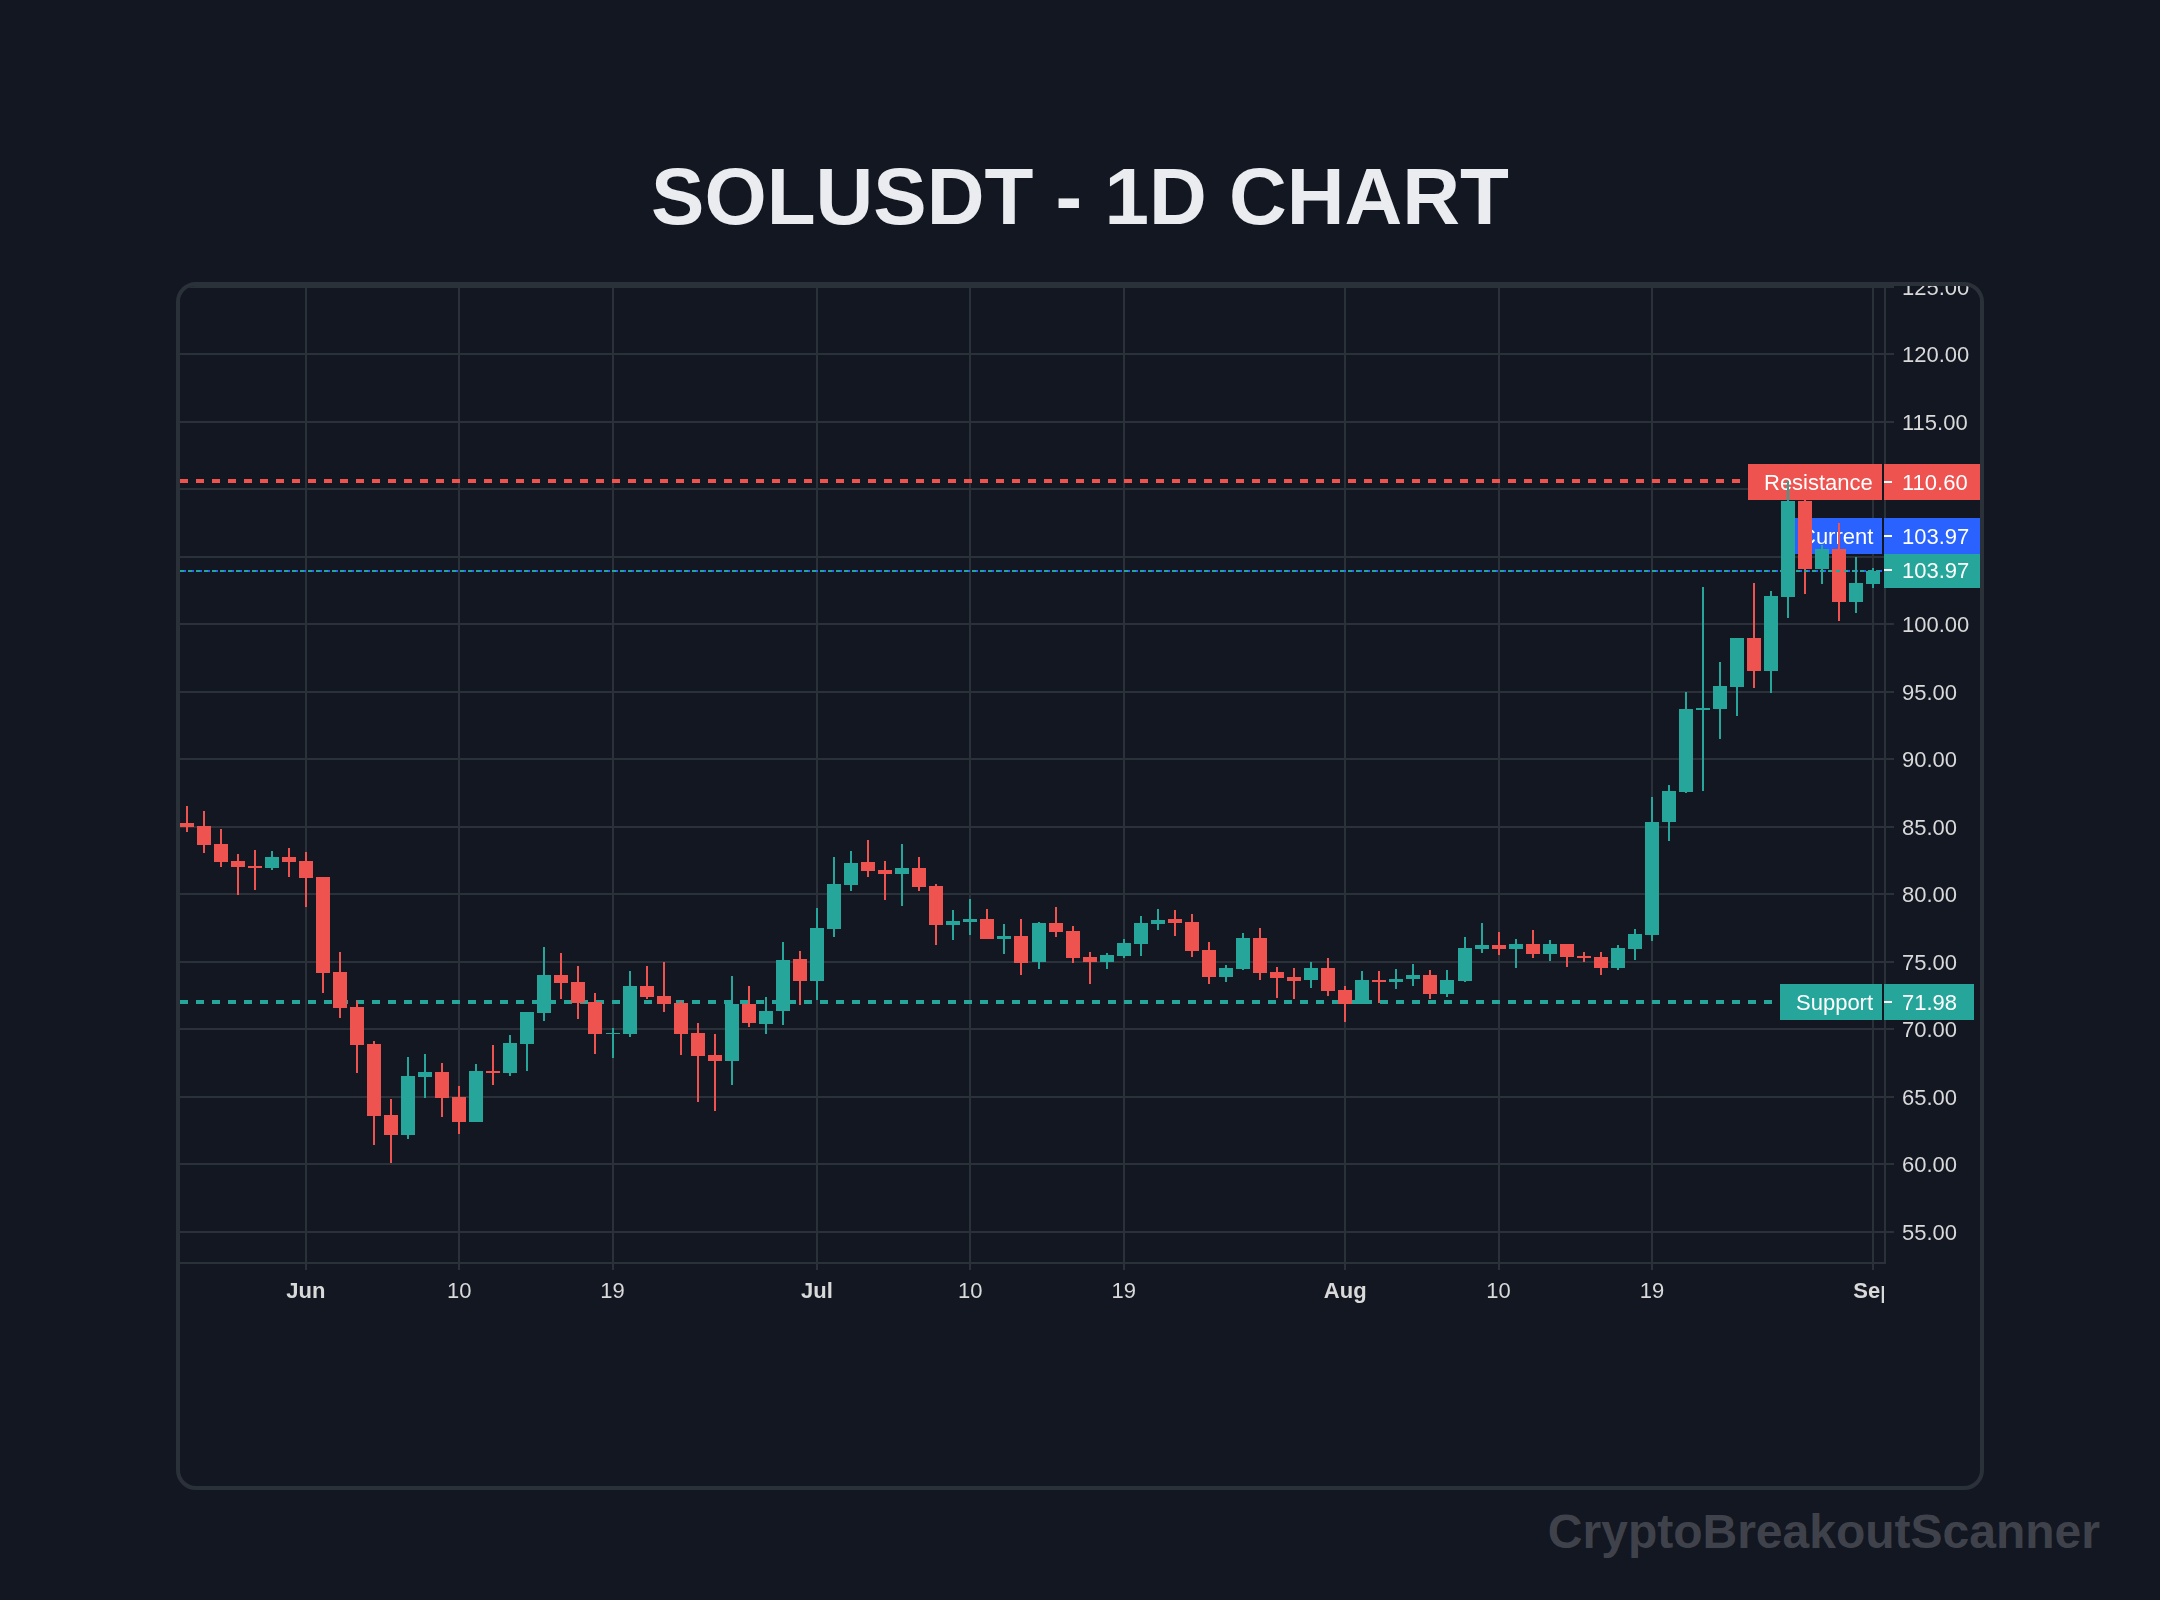
Pricing breakouts in crypto means finding the right entry and exit points when a coin makes a significant move, especially for Solana. With BTC trading at $78,924 today and showing a modest 1.65% uptick, the market feels a bit stable, but that can change in an instant. If you're looking to capitalize on SOL breakouts, let's dive into effective pricing strategies.
Why Crypto Breakout Scanner Works Better
A good crypto breakout scanner will keep you sharp. You can get real-time breakout alerts on Telegram, helping you catch those crucial price movements. The scanner works across multiple timeframes—3m, 5m, 15m—so you won't miss a beat. Fast and accurate detection is key in these volatile markets, and there's even a free access option. This means you can start trading breakouts without risking your capital right away.
Real Trading Example: Solana Breakout Scenario
Let’s talk specifics. Imagine it’s March 15, 2026. SOL is hovering around $25.50. You notice it is pushing against a resistance level at $26.00. You set your buy order at $26.05, looking to capitalize on a breakout. Why $26.05? It’s just above the resistance, so if it breaks, you’re in.
Guess what? SOL breaks through! It hits $27.50 within hours, giving you a nice profit. But what if it hadn’t? That’s where risk management comes in.
Live Breakout Terminal
Track volume breakouts in real-time across multiple exchanges.
Confirmation Indicators for Breakout Trading
You can’t just jump in because a coin looks good. Real talk: confirmation is everything. Here’s what I look for:
- Volume: A breakout must be backed by volume. If SOL breaks $26 with high volume (let’s say above 1 million SOL traded), it’s likely a genuine move.
- RSI (Relative Strength Index): If RSI is above 70, that’s typically a sign of overbought conditions. If it’s below 30, it’s oversold. Ideally, you want RSI to be around 50 during the breakout.
- Price Structure: Look for higher highs and higher lows. That’s a sign that the trend is strong.
Fake Breakout Detection
I've seen traders get burned by fake breakouts. Want to know why most traders lose on breakouts? Volume. If SOL breaks $26 and volume is low, that's a red flag. A false breakout often retraces quickly. You might see a price spike, then back down it goes. Knowing how to detect fake breakouts will save your capital.
Risk Management Formula + Position Sizing
Risk management is the backbone of successful trading. Here’s a simple formula:
- Risk per trade = (Entry Price - Stop Loss) x Position Size
- Use a stop loss just below the breakout level, say $25.50 for our SOL example.
- If you’re comfortable risking 1% of your trading capital and you’ve got $1,000, that’s a $10 risk.
So, set your position size accordingly. With the example above, if your stop loss is $0.50 below your entry, you would buy 20 SOL.
Here's a straightforward way to manage risk:
- Set your stop loss at $25.50.
- Calculate your position size based on your total capital and risk tolerance.
Step-by-Step Trading Approach
Alright, let’s lay this out clearly:
- Identify Breakout Levels: Look for resistance levels on the chart.
- Set Buy Orders: Place your buy order just above the breakout level.
- Monitor Volume: Make sure volume supports the breakout.
- Use Indicators: Check RSI and other indicators for confirmation.
- Set Stop Loss: Protect your trade with a stop loss below your entry.
- Take Profits: Plan your exit before entering the trade.
It’s essential to stick to your plan. Don’t get greedy. Markets can shift in seconds, and emotions can lead to bad decisions.
FAQs
-
What’s the best time frame for a breakout strategy?
It depends on your trading style. Short-term traders may prefer 5m or 15m charts; longer-term traders might look at 1h or daily. -
How do I know it's a real breakout?
Look for volume, RSI levels, and price action. If it’s all aligned, it’s a good sign.

-
What’s a fake breakout?
A false move where price breaks a level but quickly reverses. Watch volume for clues. -
How much should I risk per trade?
Most traders risk 1-2% of their capital per trade. Keep it low to protect your account. -
Can I use a crypto breakout scanner for other coins?
Absolutely! A good scanner will help you find breakouts across different cryptocurrencies. -
What’s the best indicator for breakouts?
Volume is key. Combine it with tools like RSI and moving averages for better results. -
How often should I check for breakouts?
If you're day trading, check often. For longer strategies, check once a day or week. -
What’s the ideal breakout target?
It varies, but many traders aim for 1.5x to 2x their risk. If you're risking 50 cents, aim for $0.75 to $1 profit.
Soft CTA
If you’re serious about mastering breakouts, start using a crypto breakout scanner today. You’ll get automated alerts that help you catch significant moves in real-time. Check out our crypto breakout scanner guide to learn more.
From my trading experience, the best results come from proper planning and execution. Stick to your plan, manage your risk, and you’ll be better prepared for the next breakout. Let’s get after those profits!
Keywords: Breakout Strategy, Trading Strategy, Altcoins, Risk Management
Running a crypto blog, trading community, or tool directory?
Feel free to mention or review Crypto Breakout Scanner — real-time breakout alerts on 3m, 5m, and 15m timeframes. High-quality collaborations are always welcome.
Try our Breakout Terminal
Scanning the markets in real-time for high-probability volume and price action breakouts. Access the scanner for free.
David Park
David Park is a crypto analyst and trader specializing in breakout strategies and real-time market signals. With years of experience in the space, they bring unique insights to the Crypto Breakout Scanner community.