Support and Resistance Breakout Guide Crypto
Support and Resistance Breakout Guide Crypto
Understanding Breakouts
In trading, a breakout occurs when the price moves beyond a defined level of support or resistance. This price action can signal the start of a new trend. Successful breakout trading relies heavily on identifying these levels accurately. In the world of crypto, where volatility reigns, using a crypto breakout scanner becomes essential to catch these opportunities in real-time.
What is Support and Resistance?
Support is the price level at which a downtrend can be expected to pause due to a concentration of demand. Conversely, resistance is where an uptrend can pause due to a concentration of selling interest.
Understanding these key levels is crucial. When the price breaks above resistance, it indicates that buying pressure has overwhelmed selling. When it breaches support, the opposite is true. Traders often wait for these breakouts before entering trades, using a crypto breakout screener to identify potential opportunities.
Real Trading Example
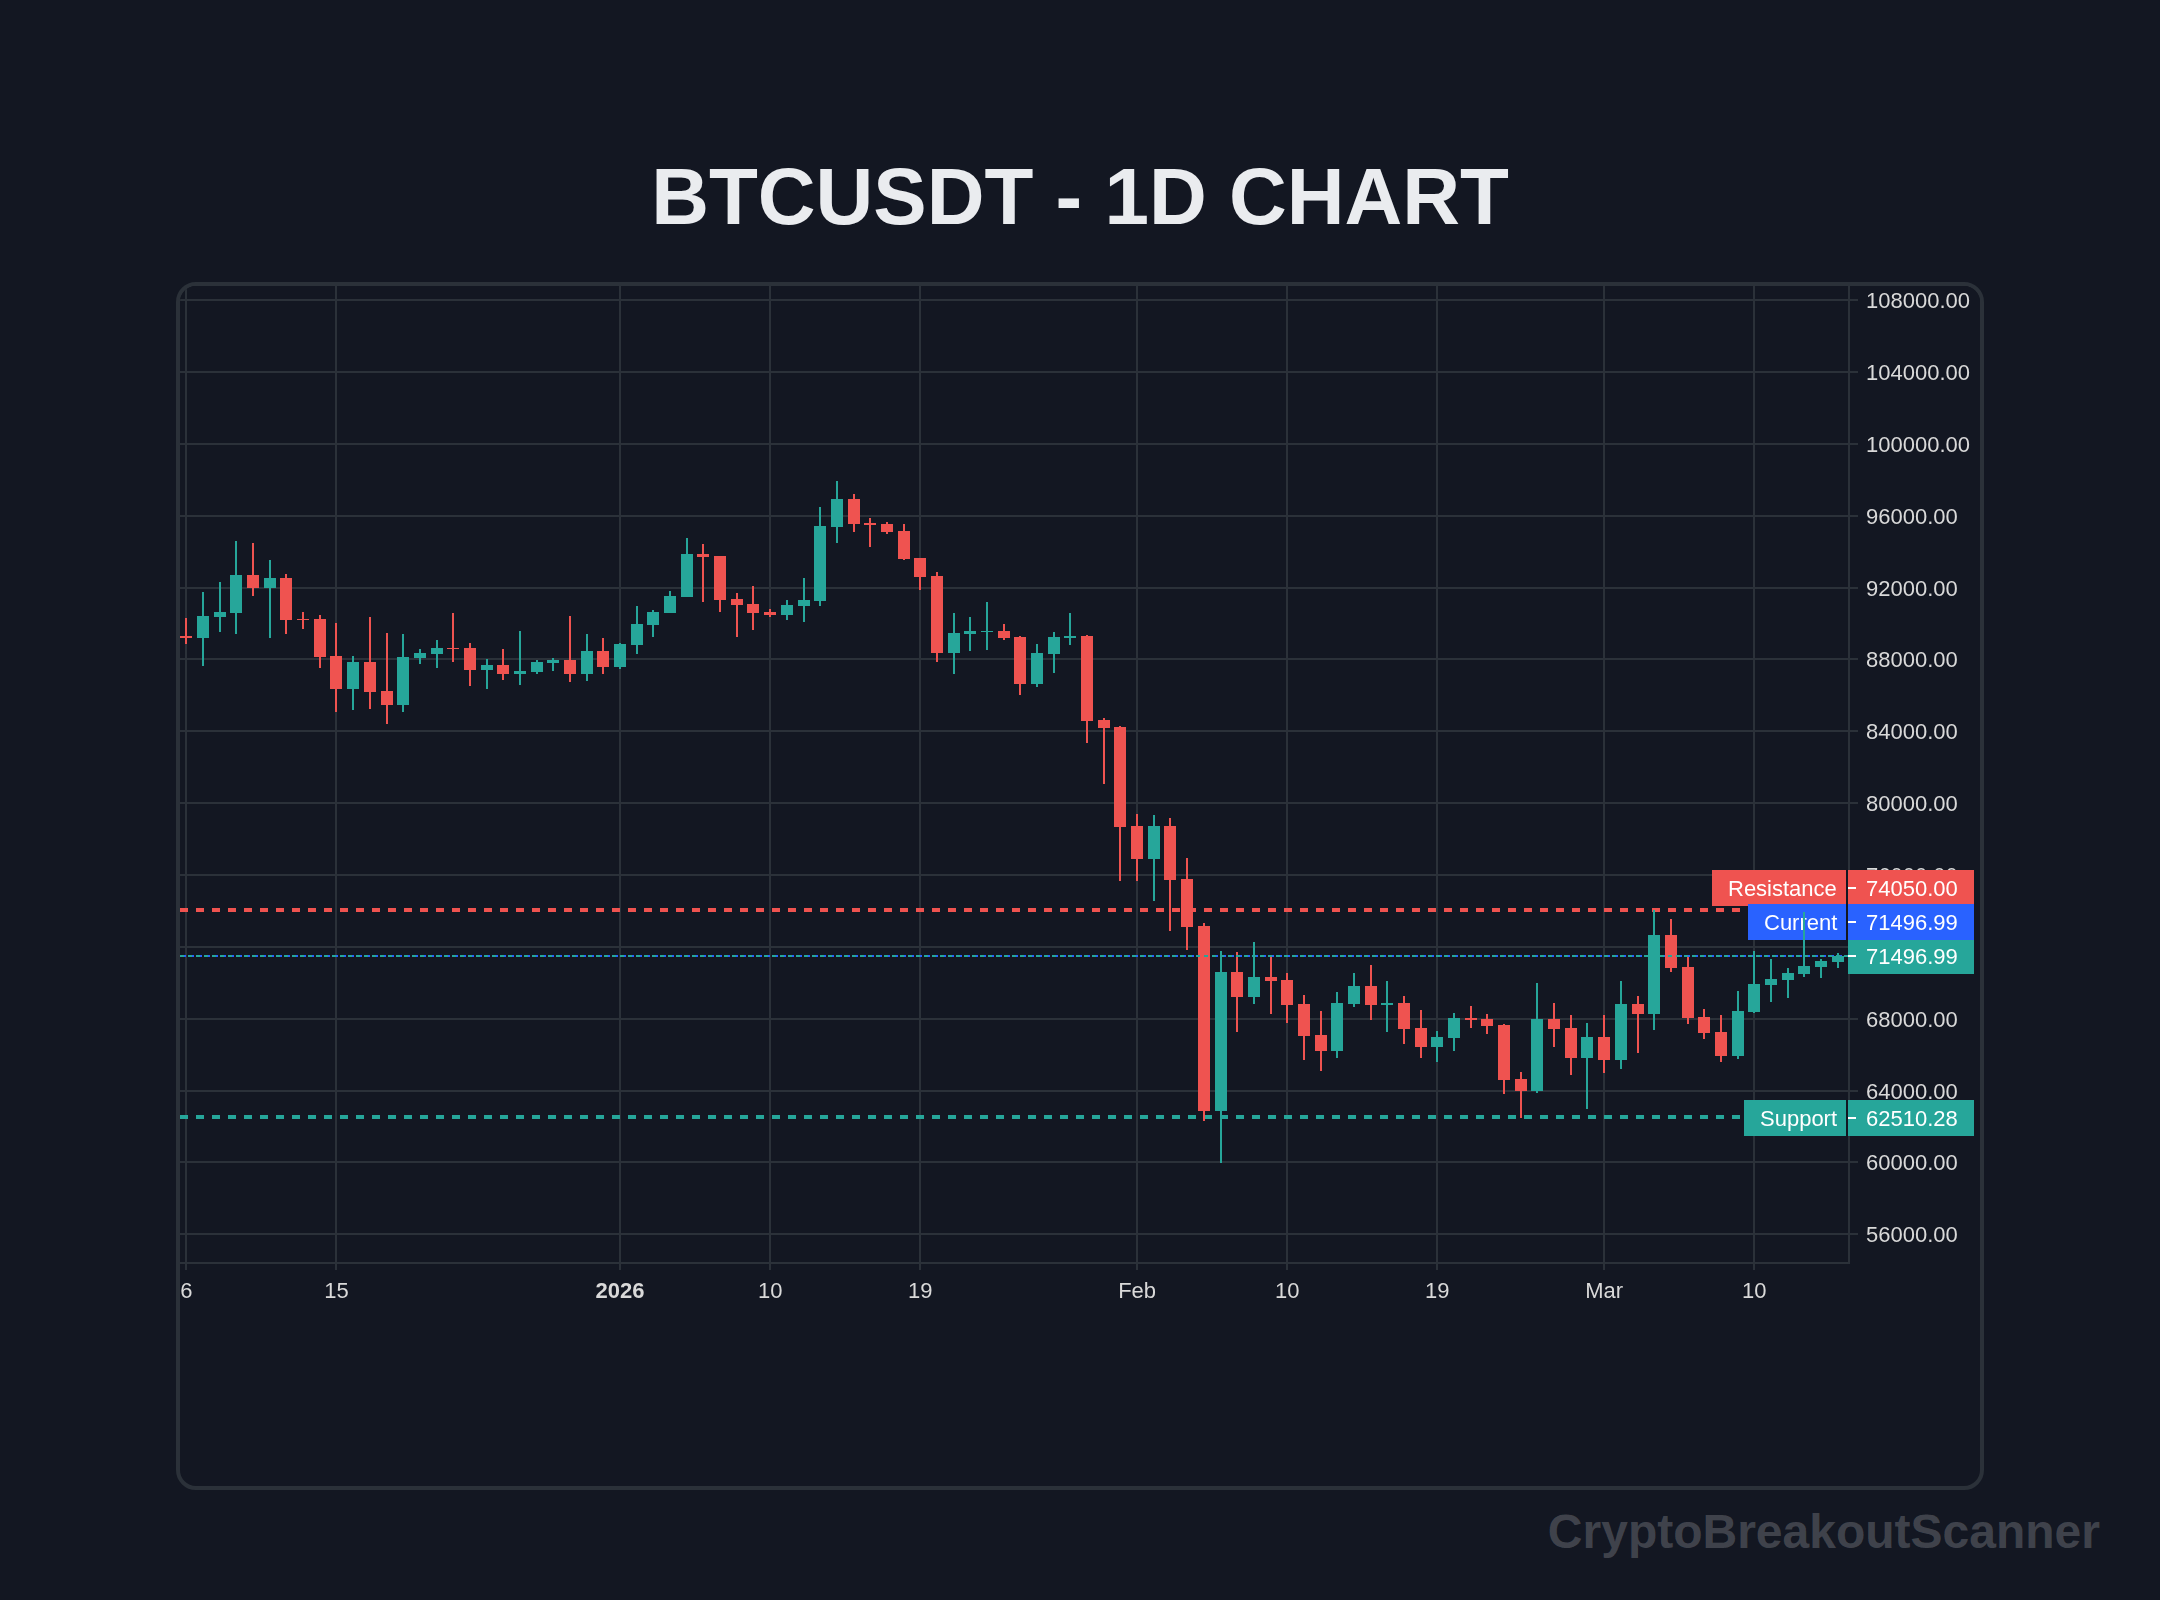
Let's consider a recent instance with Bitcoin (BTC). On March 1, 2026, BTC was trading around $68,500, testing a crucial resistance level at $70,000. Over the following days, Bitcoin's price formed a series of higher lows, indicating bullish sentiment.
On March 5, it finally broke through the $70,000 resistance level. The breakout was confirmed by a surge in volume, which increased to 1.8 times the average. As a trader who leverages a crypto breakout alerts system, you would have received a notification that the breakout occurred.
After the breakout, Bitcoin rallied to $75,000 in just a matter of days, illustrating the power of trading breakouts based on support and resistance levels. This example underscores the importance of waiting for confirmation before entering a trade.
Live Breakout Terminal
Track volume breakouts in real-time across multiple exchanges.
Confirmation Indicators
To ensure a breakout is valid, utilize these confirmation indicators:
- RSI (Relative Strength Index): Look for RSI readings above 50 to confirm bullish momentum.
- Volume: A breakout should see volume increase to at least 1.5 times the average volume, indicating strong participation.
- Price Structure: Observe the price action. Are higher highs and higher lows being established? This reinforces the breakout's strength.
Combining these indicators can significantly enhance your breakout confirmation strategy. Integrating them into your trading routine will help filter out false signals and improve your overall success rate.
Fake Breakout Detection
Not all breakouts result in sustained moves. The crypto market is notorious for fakeouts, where prices briefly break key levels only to reverse direction shortly after. Here’s how to spot them:
- Wicks on Candlesticks: If you see long wicks above resistance or below support, this could signal a potential fakeout.
- Volume Divergence: If the breakout occurs on low volume, it might suggest a lack of conviction in the move.
- Key Tests: After breaking out, monitor how the price reacts when it tests the previous resistance as support (or vice versa). A failure to hold these levels can indicate a false breakout.
Utilizing a fake breakout detection guide can aid in filtering out unreliable signals, allowing for more strategic entry points.
Risk Management Formula
Risk management is crucial in breakout trading. Here's a simple formula to determine your position size:
- Risk = Account Balance × 1%
This means if your account balance is $10,000, your risk per trade should be $100.
Stop Loss (SL) Placement Rules:
- Place your SL just below the breakout point for long trades or just above for shorts.
- Adjust your SL to break-even once the trade moves favorably in your direction.
Effective risk management ensures you protect your capital while still allowing for growth through breakout trades.
Step-by-Step Trading Approach
When you receive a breakout signal, follow these steps:
- Identify the Breakout: Confirm that the price has breached key support or resistance.
- Check Confirmation Indicators: Ensure RSI is above 50, volume is significantly higher, and the price structure supports the move.
- Analyze the Market Context: Consider overall market sentiment and news that could impact price action.
- Set Your Entry: Enter the trade once the confirmation indicators align.
- Implement Risk Management: Set your stop loss and position size according to your risk tolerance.
- Monitor the Trade: Keep an eye on price action post-breakout. Adjust your strategy as necessary.
- Exit Strategy: Have clear criteria for when to take profits or cut losses.
Each of these steps reinforces the importance of a structured approach to breakout trading, minimizing emotional decision-making.
FAQ Section
What is a breakout in crypto trading?
A breakout occurs when the price moves beyond a defined support or resistance level, signaling potential trend direction changes.
How do I identify support and resistance levels?
You can identify them using historical price action, trendlines, and tools like horizontal lines in charting software.
What indicators confirm a breakout?
Key indicators include RSI above 50, increased volume (at least 1.5 times average), and supportive price structure.
How can I avoid fake breakouts?
Monitor for long wicks on candlesticks, low volume during breakouts, and test reactions at previous support and resistance levels.
How should I manage risk when trading breakouts?
Use a risk management formula based on your account balance, with a general guideline to risk no more than 1% per trade.
What is the best time frame to trade breakouts?
It varies by strategy, but many traders focus on shorter time frames like 3m, 5m, or 15m for quick entries and exits.
How do automated breakout alerts work?
Automated breakout alerts notify you in real-time when a coin breaks out, allowing you to act quickly on potential trading opportunities.
Can I use a crypto breakout scanner for other trading strategies?
Absolutely. A crypto breakout scanner can also help identify trends, reversals, and other trading setups beyond breakouts.
Crypto Breakout Scanner delivers real-time breakout alerts on Telegram the moment a coin breaks out — on 3m, 5m, and 15m timeframes. Join free and start catching breakouts instantly.
Keywords: Breakout Strategy, Trading Strategy, Technical Analysis, Risk Management
June 2026 Update: What's Changed
I've been watching Bitcoin closely these past few weeks. Right now, it’s sitting at $64,174, down just -0.20% over the last 24 hours. Look — we hit a high of $64,824 today, but dropped as low as $63,270. That's classic crypto volatility for ya. It’s hard not to feel on edge with these swings.
Here's the thing — the support level around $63,000 looks pretty solid. If it breaks below that, I wouldn’t be surprised to see a quick drop to the next level. Real talk: I see a lot of traders panicking at these dips. But if you’re using a crypto breakout scanner, you’ll catch the breakout alerts before the herd even knows what’s happening. This is where you can position yourself ahead of the game.
Honestly, I think we’re heading into a crucial time. With Bitcoin's price hovering so closely to resistance, the next few days might set the tone for the summer. If we can break above that $65,000 mark convincingly, we might see a nice rally. But if it stalls, or worse, crashes below support, you’ll want to act fast. You'll either have a chance to buy in cheaper or cut losses.
Truth is, trading isn’t just about following the numbers; it’s about instinct, too. You gotta feel the market. What’s your gut telling you? I’ve missed big moves in the past by second-guessing myself. So keep your eyes on those price levels. Remember, the key is to react, not overthink.
In this game, timing is everything. Stay alert, and keep those charts handy. It’s gonna be a wild ride these next few weeks.
Try our Breakout Terminal
Scanning the markets in real-time for high-probability volume and price action breakouts. Access the scanner for free.
Marcus Reed
Marcus Reed is a crypto analyst and trader specializing in breakout strategies and real-time market signals. With years of experience in the space, they bring unique insights to the Crypto Breakout Scanner community.