Manual vs Automated Crypto Breakout Scanner Comparison
Manual vs Automated Crypto Breakout Scanner Comparison
Breakouts are a critical focus for serious traders in the crypto market. A breakout occurs when the price moves beyond a defined resistance level, signaling potential volatility and trading opportunities. In this article, we’ll explore the differences between manual and automated crypto breakout scanners, highlighting the advantages of automation in trading.
What is a Breakout?
In trading terms, a breakout refers to the price movement beyond a defined support or resistance level. This typically indicates a significant shift in market sentiment. Breakouts can lead to substantial price movements, making them ideal for traders looking to capitalize on volatility.
For instance, consider BTC recently trading around $69,348. When it broke above the previous resistance at $70,000, it indicated bullish momentum, leading to further upward movement. Understanding breakouts and having the right tools to detect them is essential for traders aiming to leverage these opportunities.
Real Trading Example
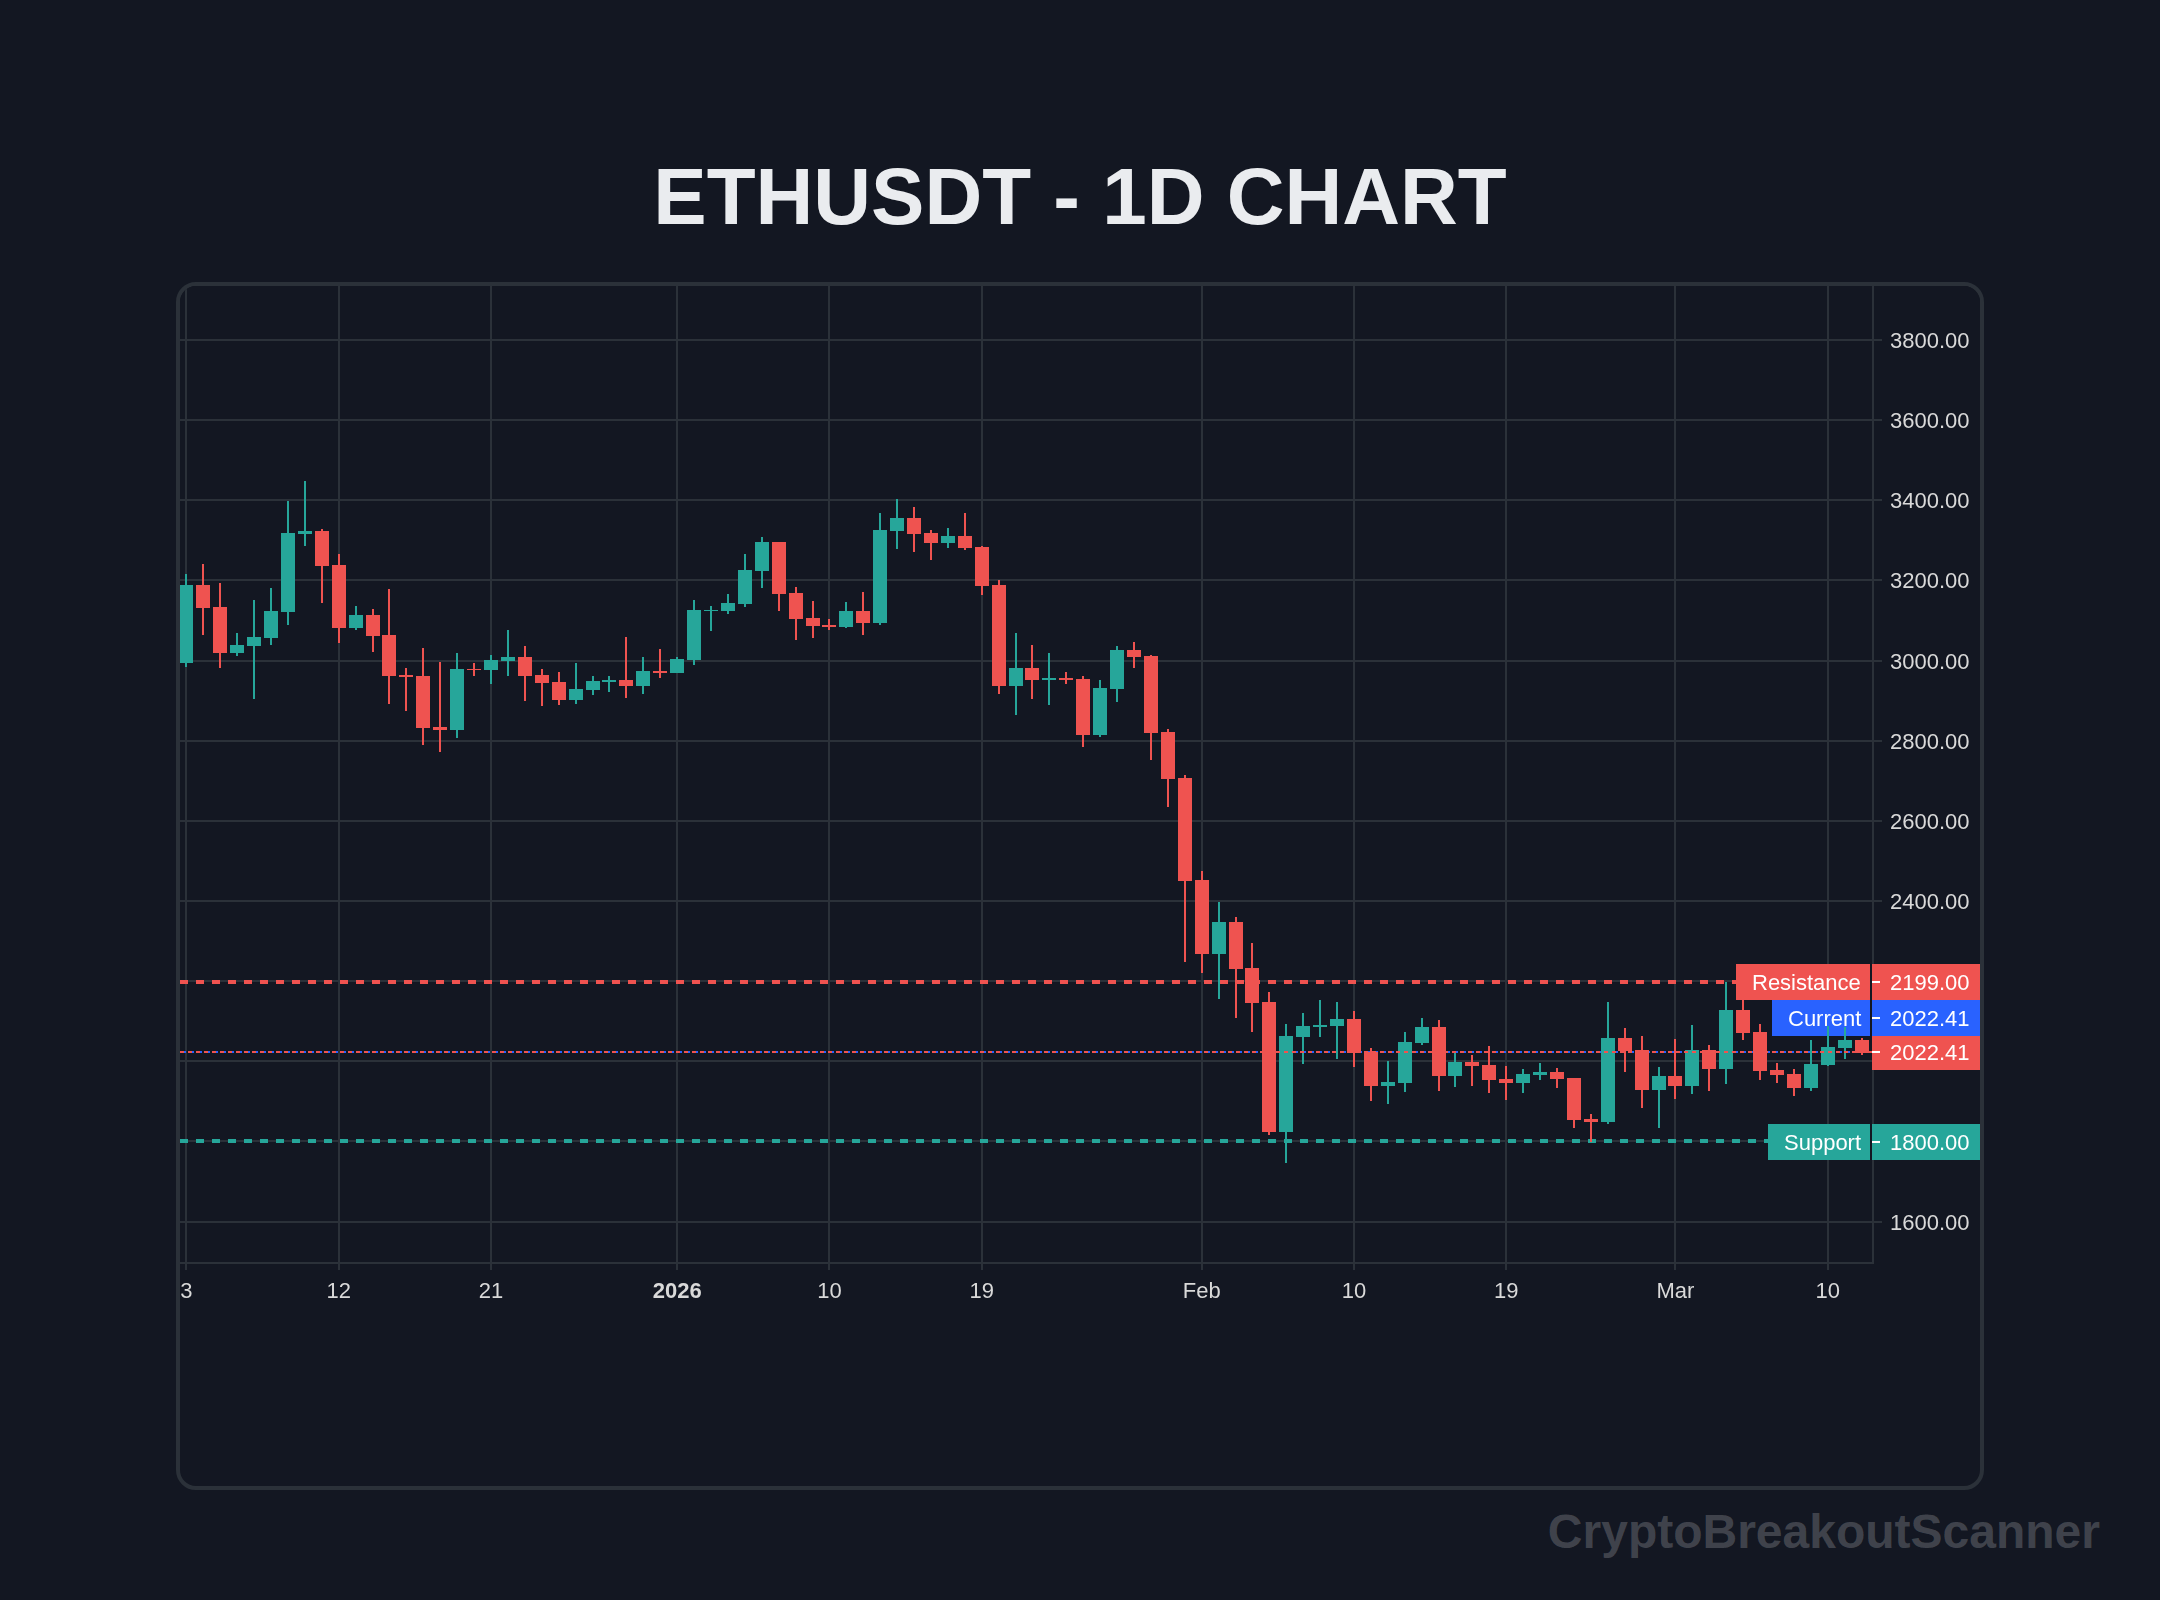
Take a look at Ethereum (ETH) during the last week. ETH was trading at $2,100, consolidating around this level for several days. On March 8, 2026, ETH broke above the $2,150 resistance with a surge in volume. This breakout was confirmed by a closing candle above the resistance level, leading to a rapid increase in price, reaching $2,300 within a few days.
The breakout scanner would have detected this movement in real-time, allowing traders to act quickly. This instant notification can mean the difference between capitalizing on a breakout and missing it entirely.
Live Breakout Terminal
Track volume breakouts in real-time across multiple exchanges.
Confirmation Indicators
Successful breakout trading relies heavily on confirmation indicators. Here are some key indicators to consider:
- RSI (Relative Strength Index): Look for an RSI above 50 to confirm bullish momentum. An RSI below 30 indicates oversold conditions, which could signal a reversal.
- Volume: A breakout should be accompanied by a volume increase of at least 1.5 times the average. This indicates strong market interest and can validate the breakout.
- Price Structure: Ensure the price closes above the breakout level on the daily chart. This closure helps confirm the breakout's strength and sustainability.
Fake Breakout Detection
One of the most frustrating experiences in trading is falling victim to a fakeout. Recognizing signs of a potential fake breakout is crucial. Here are some indicators:
- Wicks: Long wicks on candles can indicate rejection at a resistance level, signaling a potential fakeout.
- Volume Divergence: If volume decreases as the price breaks out, it may suggest a lack of conviction in the move.
- Key Levels Test: A price that quickly returns beneath a significant resistance level after breaking can indicate a fakeout.
For a more in-depth analysis of these phenomena, check out our fake breakout detection guide.
Risk Management Formula
Effective risk management is the cornerstone of any successful trading strategy. A simple position sizing formula is:
- Risk = Account Balance × Risk Percentage (e.g., 1%)
This means if you have a $10,000 account and decide to risk 1%, your maximum loss per trade would be $100.
Stop-Loss Placement: Always place your stop-loss below the last swing low for long trades or above the last swing high for short trades. This method helps protect your capital while allowing room for normal price fluctuations.
For additional insights on managing risks, refer to our article on the Breakout Trading Risk Management Formula Crypto.
Step-by-Step Trading Approach
When you receive a breakout signal, follow these steps to capitalize on the opportunity:
- Identify the Breakout: Confirm the breakout using a crypto breakout scanner or screener.
- Check Confirmation Indicators: Look for RSI, volume, and price structure that validate the breakout.
- Set Entry Point: Plan your entry just above the breakout level to catch the momentum.
- Place Stop-Loss: Set your stop-loss based on the risk management formula discussed earlier.
- Monitor Volume: Continually watch volume to ensure it remains elevated as the trade progresses.
- Take Profits: Define your exit strategy ahead of time using resistance levels or price targets.
- Review Performance: After closing the trade, analyze your performance to improve future trades.
Following this structured approach ensures you remain disciplined and can respond effectively to market movements.
FAQ Section
What is a crypto breakout scanner?
A crypto breakout scanner is a tool that detects when a cryptocurrency's price breaks above a defined resistance level or below a support level, alerting traders to potential trading opportunities.
How do automated crypto breakout alerts work?
Automated crypto breakout alerts notify traders in real-time when specific price levels are breached, allowing for quicker decision-making and execution.
Can I use a manual breakout scanner effectively?
Yes, manual scanners can be effective, but they require more time and vigilance. They rely heavily on the trader's ability to identify breakouts without automated assistance.
What are the advantages of an automated scanner over a manual one?
Automated scanners provide real-time alerts, reduce the effort needed to monitor multiple assets, and can execute trades faster than manual methods.
How do I spot a fake breakout?
Look for long wicks, reduced volume during the breakout, or a quick return below the breakout point. These signs can indicate that the breakout is not sustainable.
What is the best way to manage risk during breakout trading?
Use a position sizing formula to determine how much to risk on each trade and always place a stop-loss at a strategic level to protect your capital.
Can I combine manual and automated scanners?
Absolutely! Many traders use automated scanners for alerts while employing manual analysis to confirm breakouts and make final trading decisions.
Where can I learn more about breakout strategies?
Check out the crypto breakout scanner guide for comprehensive strategies and tips to enhance your breakout trading game.
Crypto Breakout Scanner delivers real-time breakout alerts on Telegram the moment a coin breaks out — on 3m, 5m, and 15m timeframes. Join free and start catching breakouts instantly.
Keywords: Breakout Strategy, Trading Strategy, Breakouts, Risk Management
June 2026 Update: What's Changed
I've been watching the crypto scene closely this June. Bitcoin's hovering at $64,310 with a steady 0.99% move today. If you’re like me, you're always looking for those breakouts. But here's the thing — the market's gotten a lot tighter since last year. It’s not just about price anymore; it's about timing.
Honestly, the volatility's still there, but the easy wins? They're harder to come by. Look — last summer, we saw breakouts hitting 15% gains within hours. Now? If you snagged a 3% jump, you’d be cheering. That’s why using a crypto breakout scanner can be a game changer. It spots potential breakouts faster than you can.
Real talk: I tried going full manual recently. I thought I could spot the patterns myself. Spoiler alert — I missed a couple of key moves. Automated tools can do this stuff while I grab a coffee. Breakout alerts pop up when I need them. No more staring at charts for hours on end.
But don’t get me wrong; manual trading still has its perks. You pick up instincts and get a feel for the market vibe. It’s like riding a bike. At the same time, you can’t ignore how much automation helps with speed. Ask yourself: Would you rather be trading a breakout on the latest meme coin or stuck missing out?
Keep your eyes peeled. The market's shifting fast. If you want to catch the next big wave, blend both strategies. Be the trader who’s ready for anything.
Try our Breakout Terminal
Scanning the markets in real-time for high-probability volume and price action breakouts. Access the scanner for free.
Alex Turner
Alex Turner is a crypto analyst and trader specializing in breakout strategies and real-time market signals. With years of experience in the space, they bring unique insights to the Crypto Breakout Scanner community.