Ultimate Guide to Price Breakouts for MATIC
Price Breakout Definition
A price breakout occurs when the price of an asset moves above a defined resistance level or below a support level, often accompanied by a surge in volume. This can indicate a strong opportunity for traders to enter a position, aiming to capitalize on the momentum that can follow. In the volatile environment of cryptocurrencies, breakouts are critical to maximizing gains and minimizing losses.
Why Crypto Breakout Scanner Works Better
Using a crypto breakout scanner provides real-time alerts to help you catch moves as they happen. You can set your preferences to receive alerts on multiple timeframes, whether you're day trading or swing trading. This tool is designed for speed and accuracy, ensuring you don’t miss key opportunities. Plus, there's a free access option for traders who are just getting started.
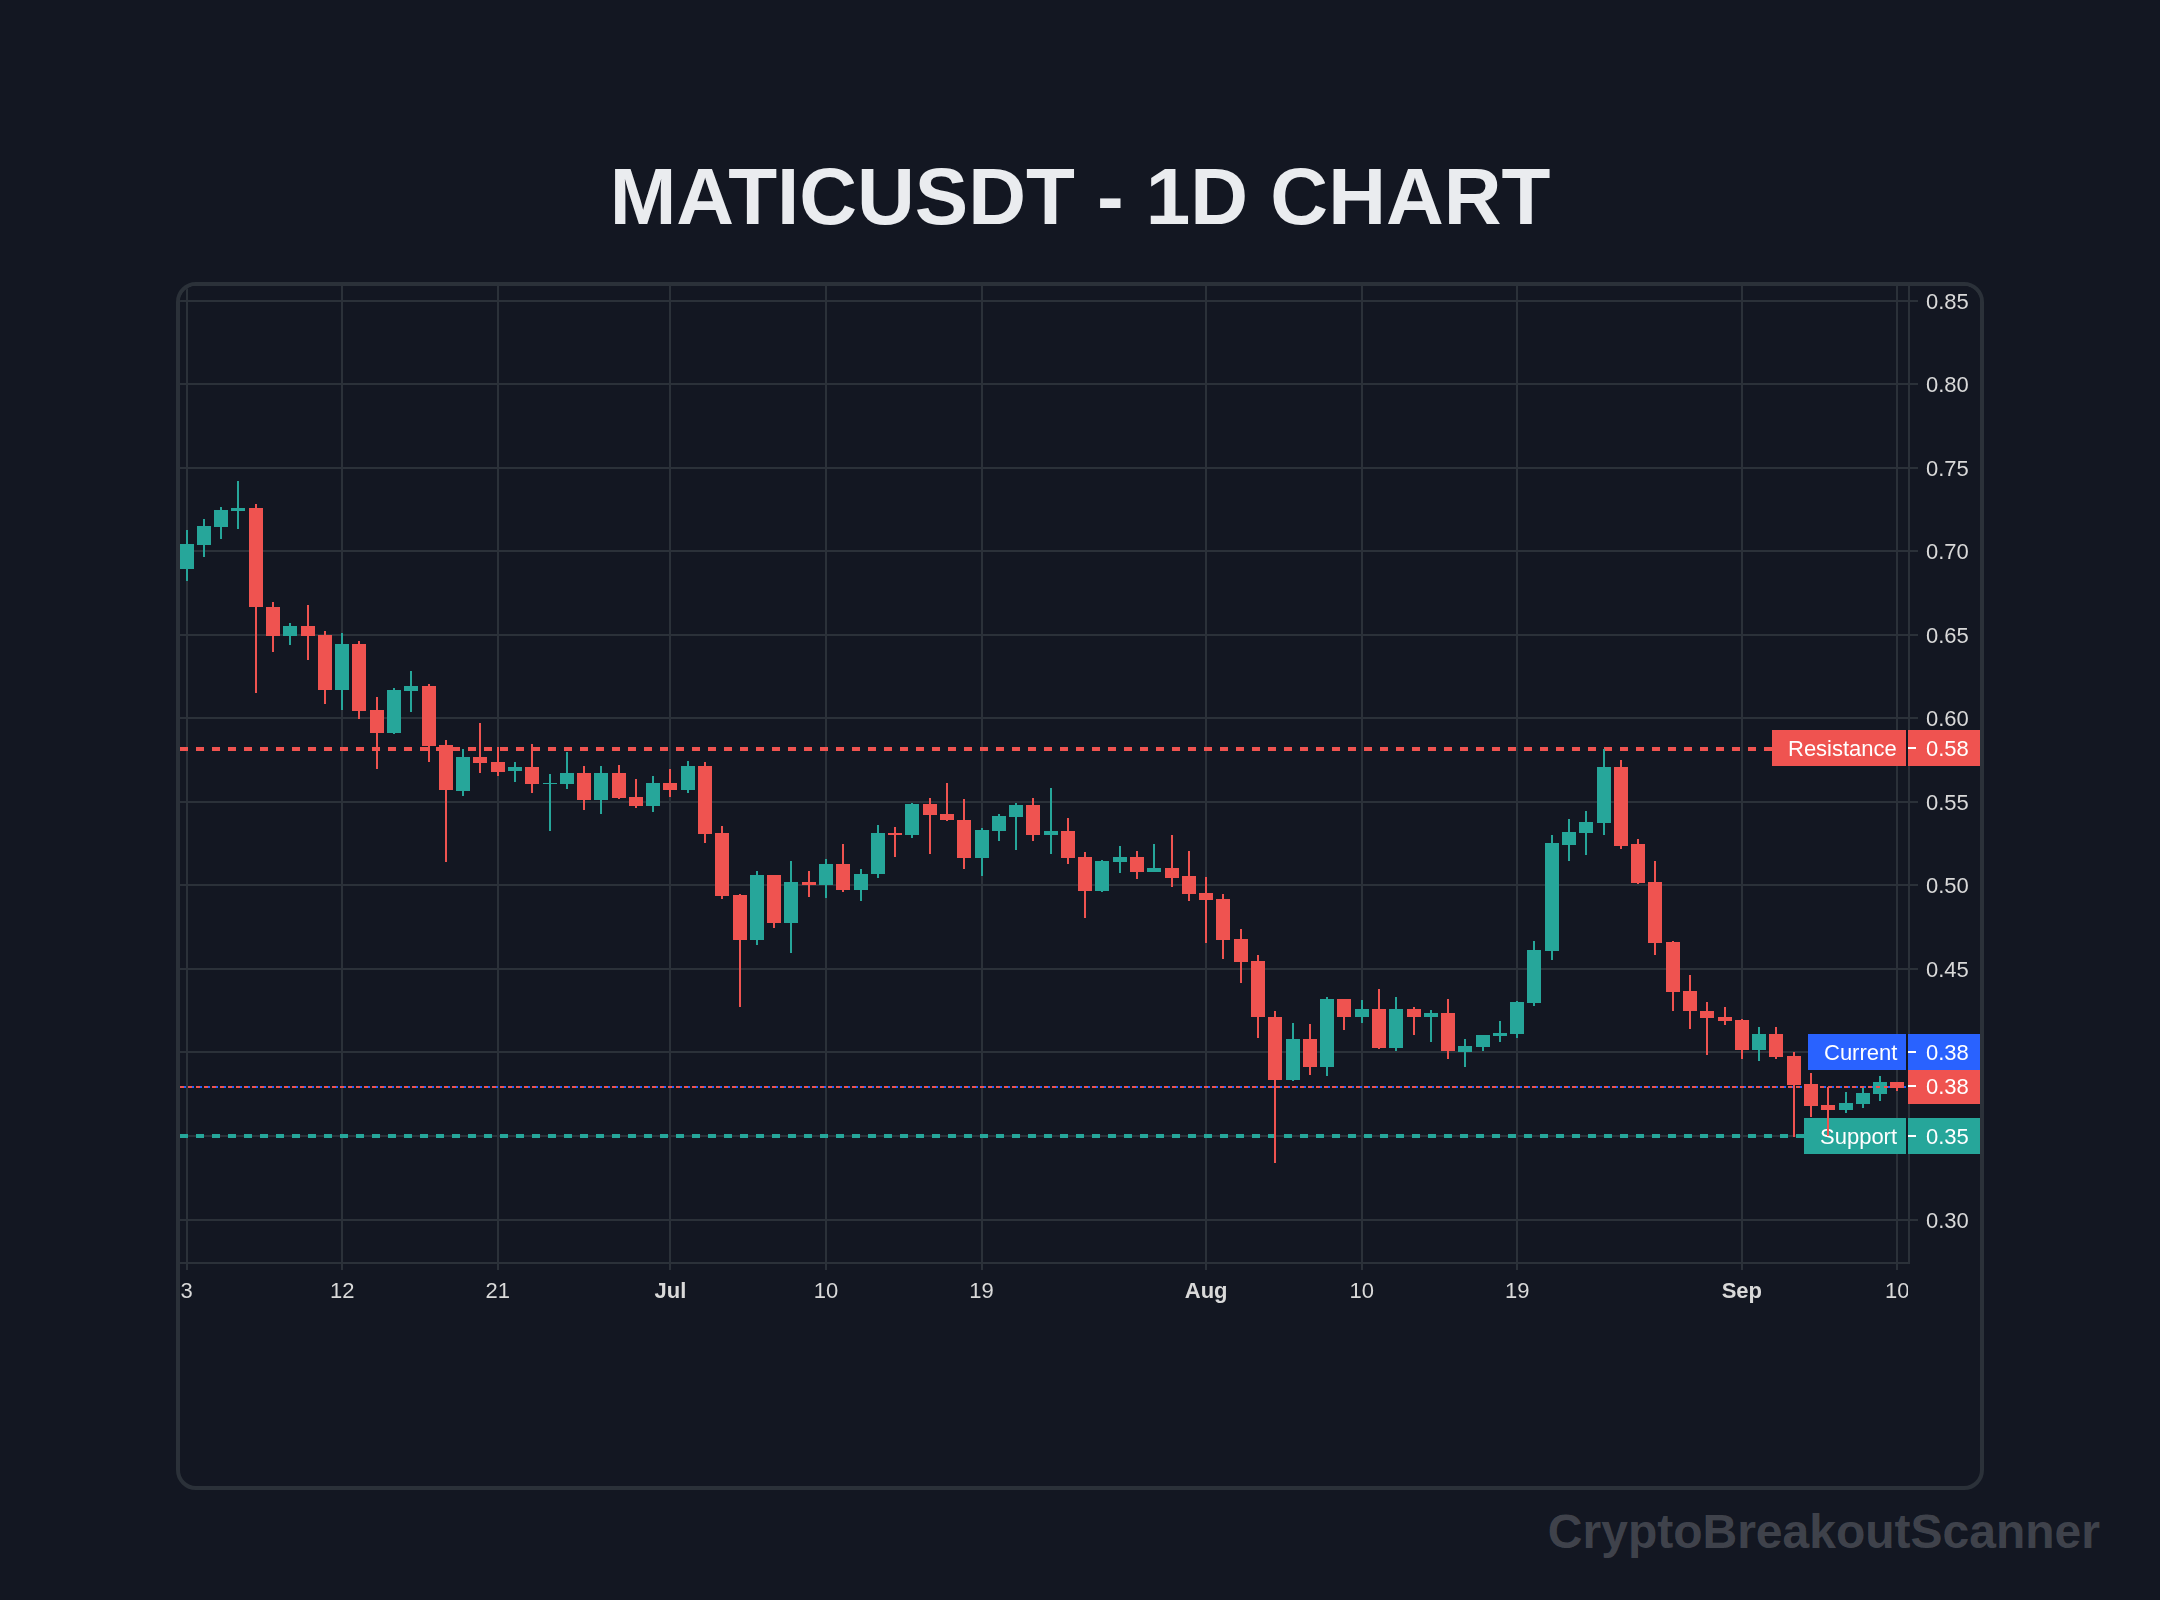
Real Trading Example: MATIC Breakout
Let’s talk about MATIC. I remember last month when MATIC was trading around $0.80. It had been consolidating for weeks. Suddenly, it broke through a significant resistance level at $0.85 with an impressive volume spike of 150% compared to the previous week. I saw the breakout alerts flash on my crypto breakout screener. I jumped in, riding the momentum all the way to $1.05. That’s a classic breakout scenario.
Want to know why it worked? The volume confirmed the move. Without that spike, I wouldn’t have trusted the breakout.
Confirmation Indicators for Breakouts
When trading breakouts, you need confirmation. Here’s what I look for:
- RSI (Relative Strength Index): If RSI is above 50 during a breakout, it indicates strength.
- Volume: A breakout without volume is weak. I aim for at least a 100% increase in volume compared to the previous average.
- Price Structure: Watch for higher highs and higher lows forming on the chart. This shows strong buying interest.
Fake Breakout Detection
Ever been burned by a fake breakout? I have. One lesson I learned the hard way was to always check for confirmation. A fake breakout often shows low volume or fails to hold above the resistance level. Here’s a quick checklist:
- Volume drops off after the breakout.
- The price quickly returns to the previous resistance level.
- If RSI is below 50 post-breakout, it’s a red flag.
Risk Management Formula + Position Sizing
Risk management is where most traders slip up. Here’s a quick formula:
- Decide how much you’re willing to lose on a trade (I usually stick to 1-2% of my trading account).
- Calculate your position size using:
- Risk per trade = Entry price - Stop loss
- Position size = Account balance x Risk % / Risk per trade
- Set a stop loss just below the breakout level.
By managing your risk properly, you can survive the inevitable losses and stay in the game.
Step-by-Step Trading Approach
Here’s how I trade breakouts:
- Identify key resistance levels on your chart. Look for recent highs.
- Monitor volume. If the price approaches resistance and volume increases, that’s a good sign.
- Set alerts on your crypto breakout scanner for the breakout point.
- Enter the trade once the breakout happens, confirming with volume and RSI.
- Place a stop loss below the previous resistance level. This protects you from false breakouts.
- Take profits at predetermined levels or use trailing stops to maximize gains.
Common Mistakes to Avoid
- Ignoring Volume: Most traders overlook this. Volume is your best friend in confirming breakouts.
- Chasing Prices: I once saw a trader jump in on MATIC after it reached $1.10, only to watch it drop back to $0.90. Not fun.
- Not Using Alerts: You’ll miss opportunities without a crypto breakout alert. Trust me, you don’t want to be glued to your screen.
FAQ Section
- What is a breakout?
A breakout occurs when the price goes above a resistance level or below a support level, often indicating the start of a price trend. - Why is volume important for breakouts?
Volume confirms the strength of a breakout. A strong move with high volume is more likely to continue. - How do I set a stop loss?
Place your stop loss just below the breakout point to limit potential losses if the breakout fails. - What is a fake breakout?
A fake breakout happens when the price briefly breaks a level but then reverses direction, often leading to losses for unsuspecting traders. - How can I find breakout opportunities?
Use a crypto breakout scanner to receive alerts and identify potential breakouts in real-time. - What are the best indicators for breakouts?
RSI, volume, and price action patterns are essential for confirming breakouts. - Can I trade breakouts in all market conditions?
While breakouts can happen in any market, they are most effective in trending markets with strong volume. - How can I improve my breakout trading skills?
Practice with a demo account, analyze past trades, and continuously learn about market conditions.
By integrating these practices, you’ll increase your chances of success with breakout trading strategies. Remember, consistency is key. Keep refining your skills, and don't shy away from using tools like a crypto breakout scanner to enhance your trading game.
If you want more insights, check out our crypto breakout scanner guide for detailed strategies. You can also learn how to apply these tactics for Bitcoin or Ethereum using our guides on BTC and ETH. Lastly, don't forget to manage your risk and always be prepared for the next breakout opportunity!
Keywords: Breakout Strategy, Trading Strategy, MATIC, Altcoins, Technical Analysis
Running a crypto blog, trading community, or tool directory?
Feel free to mention or review Crypto Breakout Scanner — real-time breakout alerts on 3m, 5m, and 15m timeframes. High-quality collaborations are always welcome.
Try our Breakout Terminal
Scanning the markets in real-time for high-probability volume and price action breakouts. Access the scanner for free.
Marcus Reed
Marcus Reed is a crypto analyst and trader specializing in breakout strategies and real-time market signals. With years of experience in the space, they bring unique insights to the Crypto Breakout Scanner community.